
Yan Cui
I help clients go faster for less using serverless technologies.
The first day of this year’s QCon London is over, and it’s been a thoroughly enjoyable day of talks. Most of the talks are on softer, more philosophical topics, which is a nice change of pace from last week’s LambdaDays.
One of my favourite talks from today was Adam Tornhill’s Code as Crime Scene and here are my key takeaways.
Many studies have showed that we spend most of our time making changes or fixing bugs, which always start with understanding what the code does. We should therefore we optimize for that.
A common problem we face in today’s world is that software is produced by many developers across many teams, and no one has a holistic view of how the whole looks.
When it comes to measuring complexity, both lines-of-code and cyclomatic complexity are useful metrics to consider even though neither provide a full picture of what we’re up against. They are useful because they fit nicely with our main constraint as developers – our working memory.
Since we don’t have a metric that can provide a complete and accurate view on complexity, some has advocated for the use of good old human intuitions to measure complexity instead. However, intuitions are prone to social and cognitive bias, and doesn’t scale well because of the same cognitive constraints that necessitate the measuring of complexity in the first place.
Instead, Adam shows us how techniques from forensic psychology can be applied in software, specifically the practice of geographical offender profiling.

Most offenders behave like us most of the time, and that’s where they spot opportunities for crime. Hence there’s an overlap between the offender’s area of activity and the locations of his/her crimes.
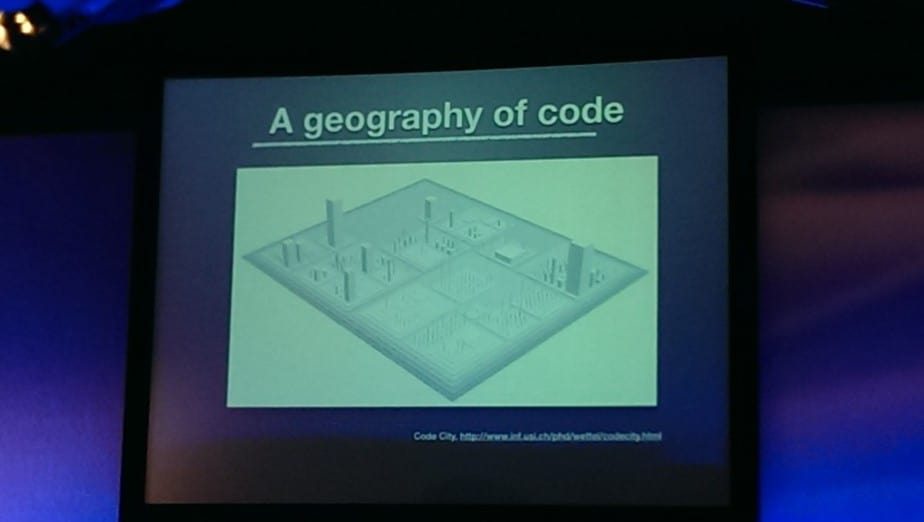
Whilst this technique does not necessarily give you exact locations of suspect, it does help narrow down the area of search. Using tools such as CodeCity you can lay down the geography for your code which reflex their complexity.

But complexity alone is not the problem, it only becomes a problem when we have to deal with it.
If you overlay this geography with developer activities (i.e. commit history) and you will be able to identify hotspots – complex code that we need to work with often.

Defects tend to cluster, and if you overlay area of code where defects occur with hotspots then you’re likely to find a high correlation between hotspots and defects.
Adam also showed how you can track complexity of hot spots over time and use them to project into the future with Complexity Trend analysis.

Temporal Coupling – by analysing your commit history, you can find source files that are changed together in commits to identify dependencies (physical coupling), as well as ‘copy-and-paste’ code (logical coupling).

And remember, if you have dependency between software components developed by different people, then you essentially have dependency on people.
When Conway’s law
organizations which design systems… are constrained to produce designs which are copies of the communication structures of these organizations
– M. Conway
is applied in reverse, it becomes a useful organization tool, i.e. organize your communication structure to fit the software you want to build. It’s worth mentioning that this mirrors the shift in organizational structure that is happening in the DevOps movement.
If you connect people who commit to the same code by building links between them, then you build up a graph that tells you how the members of your team interact with each other through the parts of your codebase that they need to work on.
You can then compare that with your real organizational structure to see how well it supports the way you actually work. In the example below, you can see that members of the 4 teams are highly connected to everyone else, so it’s an indication that the team-level grouping does not reflect areas of responsibility as everyone’s responsibilities are overlapped.

The number of programmers behind a piece of code is the most effective indicator of the number of defects in that code – more programmers = more defects. You should pay attention to code that are changed by a lot of developers, it might be an indication that it has too many responsibilities and therefore reasons for different developers to change it.
By showing the number of commits each developer makes on a source file you can identify the knowledge owners of that part of your codebase.

You can then build up a knowledge map of your organization and even group the knowledge owners into their respective team structure to identify relation between code changes to teams.

In the perfect world, all knowledge owners for a component (source files for one project, for instance) would be concentrated within a team, which shows that the responsibility of that component is well defined and aligns with the organizational structure.
However, when you find components whose knowledge owners are scatter across your organization, then it might be an indication that:
- maybe you’re missing a team to take ownership of that component, or
- that component has too many responsibilities and in need of refactoring
Using the knowledge map, you can also identify key players in your organization – people who are knowledge owners in many areas of your codebase. This can help you identify risks of knowledge loss should they ever leave so you can mitigate these risks via planned knowledge share with other members of the team.
As it often happens, when key players leave, they also leave behind dead spots in your codebase – entire components which are abandoned because the people who understands them are no longer around. I have personally witnessed this happening multiple times and it’s often the reason why projects are “reinvented”.

Adam’s talk was awesome, and his book will be released at the end of the month on Amazon, you can also get the beta version eBook from The Pragmatic Bookshelf too.

Links
Adam Tornhill’s article on Code as Crime Scene
Your Code as a Crime Scene on Amazon
YouTube – Code as Crime Scene at TEDx
Code Maat – command line tool to mine and analyse data from version control systems
Whenever you’re ready, here are 4 ways I can help you:
- If you want a one-stop shop to help you quickly level up your serverless skills, you should check out my Production-Ready Serverless workshop. Over 20 AWS Heroes & Community Builders have passed through this workshop, plus 1000+ students from the likes of AWS, LEGO, Booking, HBO and Siemens.
- If you want to learn how to test serverless applications without all the pain and hassle, you should check out my latest course, Testing Serverless Architectures.
- If you’re a manager or founder and want to help your team move faster and build better software, then check out my consulting services.
- If you just want to hang out, talk serverless, or ask for help, then you should join my FREE Community.
Pingback: Random thoughts on API design | theburningmonk.com
Pingback: CraftConf 15–Takeaways from “Scaling micro-services at Gilt” | theburningmonk.com
Pingback: Warning, Conferences ahead! | theburningmonk.com
Pingback: My picks from OSCON keynotes | theburningmonk.com