
Yan Cui
I help clients go faster for less using serverless technologies.
In Here Be Monsters, we have a MMORPG that is content-heavy with over:
- 5000 items
- 800 recipes
- 500 locations
- 1500 quests
and since the contents are highly connected, it makes balancing the game a rather interesting and challenging problem for our small team behind the project.
The Challenge
Consider a simple example involving the Camouflage Trap, which is one of the very first traps you’ll make. It’s made from a number of ingredients, each can be:
- found in the certain parts of the world
- purchased at shops
- awarded for completing quests/achievements
- crafted using other ingredients
Now, suppose you want to raise the price of basic ingredients such as Water, that increase needs to propagate all the way through the chain.
Furthermore, when you consider how many items are made from Water, and how many more items are made from those items.
There’s a huge knock-on effect here. Failing to address these knock-on effects will create arbitrage opportunities in your economy for players to exploit. They will be able to mine coins by buying and selling items and will therefore have less need to make real-money purchases with us.
As a game designer, whenever you want to make a change you are faced with this huge uncertainty because of the hidden knock-on effects that you don’t see.
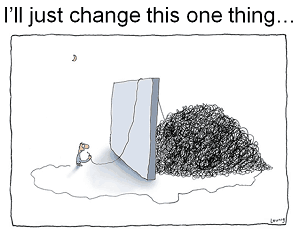
It’s a complexity that we have to manage, but managing this complexity by hand is:
- laborious – involving many iterations of trial and error, and likely repeated each time new contents are added
- slow
- error prone
- subjective – what ‘feels’ right can vary greatly from person to person
Instead, we opted for a more automated process whereby every item’s intrinsic value in the game can be evaluated based on the values of its inputs (e.g. baits for monsters, ingredients for crafted items, etc.). The amount of time involved, and your chance of success is also taken into account. We can then use the intrinsic value of an item to drive or quantify other less tangible aspects of the game’s model.
This is where Neo4j comes in.
Hello, Neo
One of the main challenges that came up in our effort to automate the economic balancing was to understand the complex relationships between items, quests, achievements, as well as locations and activities that can be performed against/with specific items at specific locations.
Take Bigfoot as an example, from his almanac page in the game:
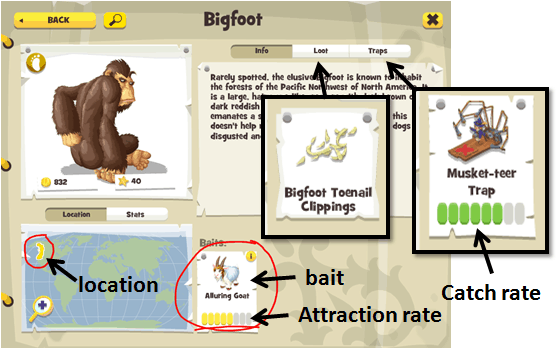
We can see that to catch the Bigfoot you need to consider:
- location – he’s only available in certain parts of the world
- bait – to lure him out you need the Alluring Goat which gives you a roughly 4 in 7 chance of seeing the monster
- trap – you need a trap strong enough to hold him after you’ve managed to lure him out, the Musket-teer Trap has a 5 in 7 chance of success
- loot – upon a successful catch, Bigfoot occasionally drops Bigfoot Toenail Clippings as loot, which you might need in future quests or as ingredient to make other items
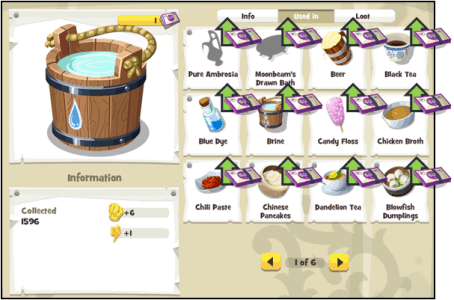
We can model all the information we see on this screen as a graph in Neo4j: 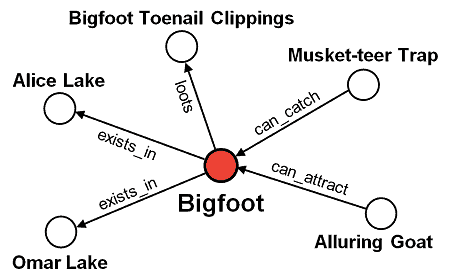
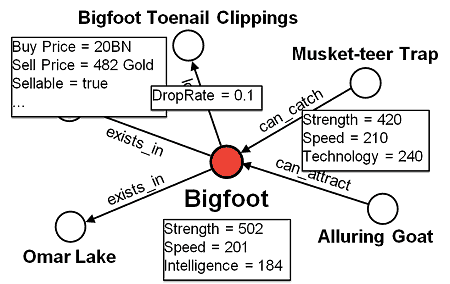
Additionally, each node and edge can have an arbitrary set of properties.
For instance, Bigfoot and the Musket-teer Trap will have their stats. The lootsrelationship that exists between Bigfoot and his loot will also specify the chance of him dropping the loot.
Looking beyond the immediate connections to Bigfoot, the Alluring Goat and Musket-teer Trap each have numerous connections of their own.
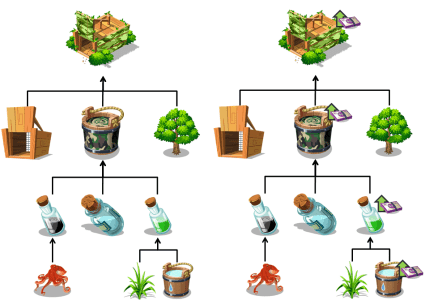
To make the Alluring Goat, you need to gather:
- Honey, which you need to build a Bee Hive in your homestead and harvest from it;
- Goat, which you can buy from animal traders in cities around the world such asLondon and NanJing;
- Golden Hair, which is a loot dropped by Blonde Mermaid, Dandelion Pixie and Blonde Selkie;
- …
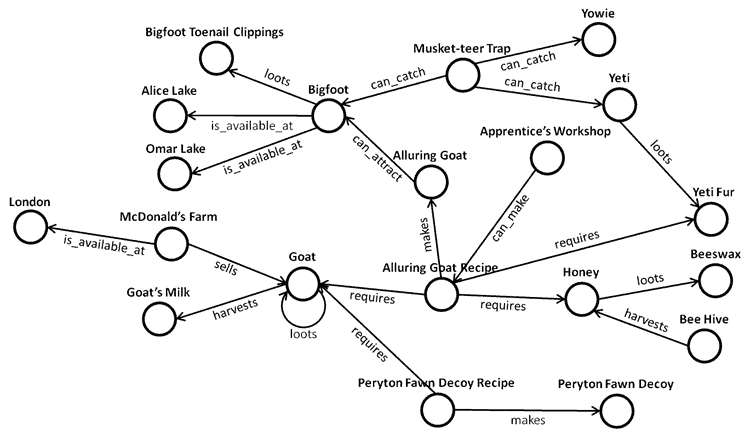
This diagram illustrates the highly connected and complex nature of the data we’re dealing with – the result of us making a game where everything you can do and every item you find has a purpose and can be used for something else.
It is also by no means an unconnected subset of the overall graph. For simplicity sake I have omitted many types of relationships and connected nodes.
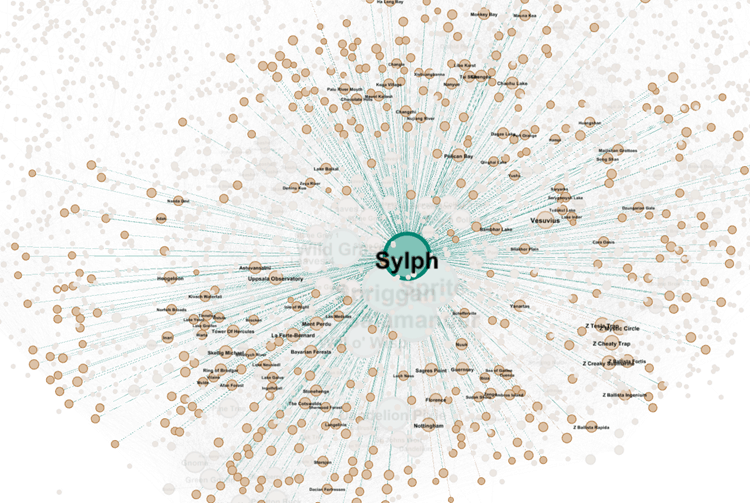
Visualizing the 8,000+ nodes and around 40,000+ edges in Gephi, where the colour and size of the nodes represent the number of connections they have, this is what the internal data model for Here Be Monsters look like:
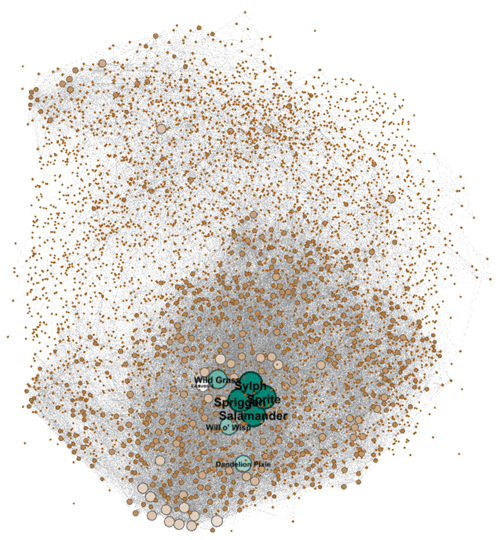
As you can see, the degree of connectedness varies greatly. For common low-level monsters such as Sylph, Spriggan, Sprite and Salamander, they are each connected to no less than 300 locations, traps and items.
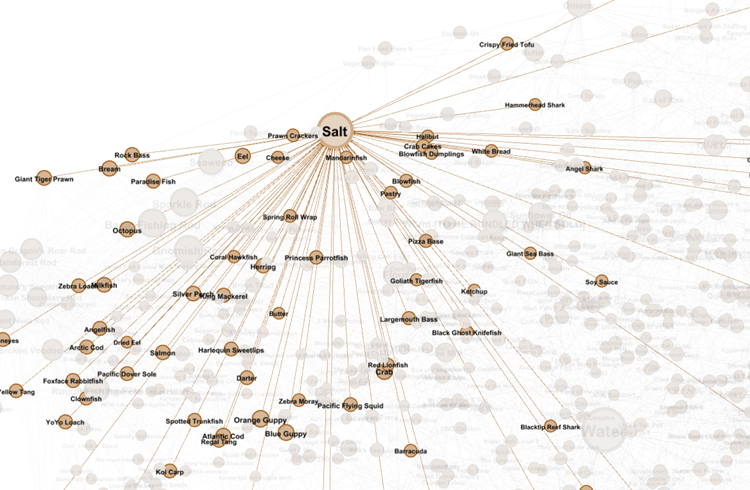
Similarly, for common ingredients such as Salt, it can be found through many items (e.g. most fish drop Seaweed and Salt as loot when you catch them) and is used in many recipes – Pastry, Pizza Base, Ketchup to name a few.
With the internal data model captured as a graph in Neo4j, we were able to ask some interesting questions that would have been difficult or impossible to answer otherwise.
To give you a few examples.
Impact Analysis
In the earlier pricing example with Water and Camouflage Trap, the key challenge is to be able to understand the impact of change. This is a very similar problem to the ones you face in derivative pricing in Finance.
If you take White Bread as an example, to work out the blast radius of a price change, let’s look at the relationships that exist between an item and a recipe.
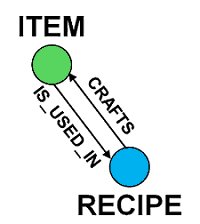
To find all the items that are made from White Bread, directly or indirectly, we can run the following Cypher (which is the built-in query language for Neo4j) query against our Neo4j database:
MATCH
(wb:BaseItem { Name:”White Bread”})
-[rel:CRAFTS | IS_USED_IN*1..]
->(i:BaseItem)
RETURN i, rel, wb
Couple of things to note from this query.
- notice how we are basically pattern matching against the graph using the pattern
node-[relationship]->node? - we capture the nodes and relationships into variables
wb,iandrelso we canreturnthem from the query; - we can optionally filter the nodes by type, e.g.
(i:BaseItem)will only match against nodes that are of typeBaseItem; - to identify White Bread, we also filter one of the nodes by the value of its properties, in this case the node
wbmust have aNameproperty with the value ofWhite Bread; - we can use OR semantic when filtering on relationship types, here we’re looking for relationships of type
CRAFTSorIS_USED_IN; - for the pattern to work, there must exist 1 or more instance of such relationships between any two nodes, hence the cardinality of
*1..
Running this query yields the following result, where the purple nodes are items and red nodes are recipes.
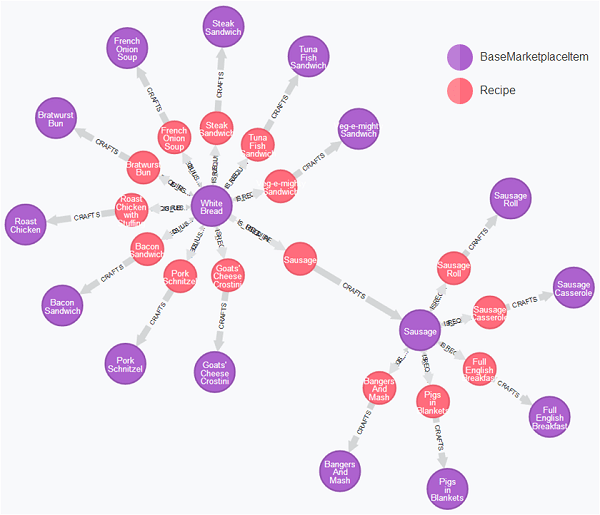
From this graph we can see that White Bread is used directly in 10 recipes, and then indirectly (virtue of being an ingredient for making Sausage) in a further 5. If we were to change the price of White Bread, all 15 of these items will need to have their prices adjusted based on the number of White Bread required to make them.
For example, if it takes 2 pieces of White Bread to make 1 Sausage and 2 Sausage to make a Full English Breakfast, then the change to White Bread‘s price would need to be multiplied by 4 when applied to Full English Breakfast.
Scarcity Analysis
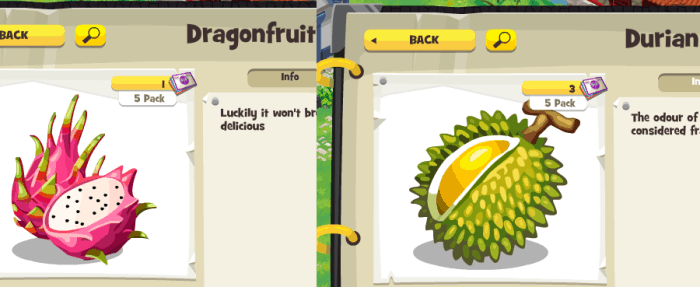
Not all items can be priced as derivatives of others. Some need to be priced based on their scarcity in the world, such as the fruits that you can forage from fruit trees you find on your travels.
To find out how scarcely available Durian and Dragonfruit is, we can use the following Cypher query:
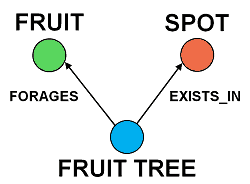
MATCH
(fruit)<-[:FORAGES]-(tree)-[:EXISTS_IN]->(spot)
WHERE
fruit.Name=‘Durian’ OR fruit.Name=‘Dragonfruit’
RETURN fruit, tree, spot
Again, we’re simply pattern matching against our graph using the pattern node<-[relationship1]-node-[relationship2]->node. The expressive power of Cypher lies in the ability to take our relationship diagram above and translate it like-for-like into an executable query.
You might also noticed that I’m not filtering any of the nodes by type here. This is because I know those relationships exist only between the specified types of nodes, hence it’s safe for me to omit them.
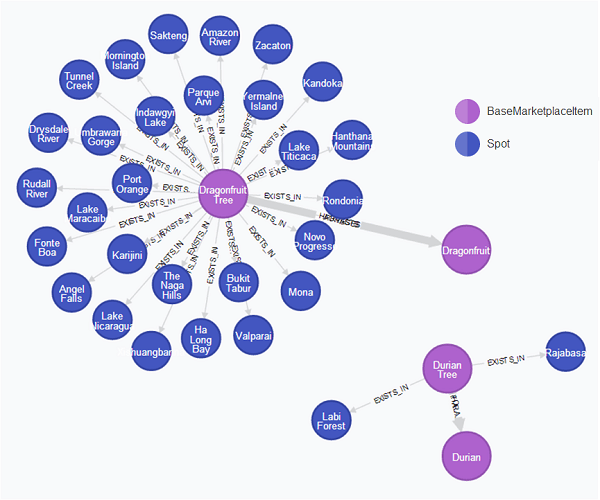
Immediately, you can see that Dragonfruit Tree is much more readily available in the world compared to Durian Tree. However, you still need to consider:
- the number of trees at each location, which you can find out from the
EXISTS_INrelationship - the number of fruits you get by foraging the tree, which you can find out from the
FORAGESrelationship
Taking all these factors into account, we can set prices for Durian and Dragonfruit which reflects their scarcity in the world.
Quest Progression
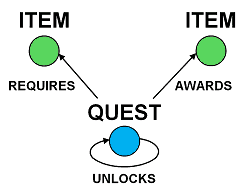
Some quests require specific items to complete. For instance, an NPC might ask you to fetch an item from Bob in Cambridge, or find some feature under a rock somewhere, or catch a Griffin and get a Griffin Egg as loot.
On the other hand, completing a quest can sometimes award you items as well. If the quest is part of a quest line then you will also unlock follow-up quests too, so there is a self-recursive relationship there.
To answer questions such as
What comes after the Year of the Horse quest?
you can use a simple Cypher query like the one below.
MATCH
(q1:Quest { Name: “Year of the Horse” })
-[:UNLOCKS]
->(q2:Quest)
RETURN q1, q2
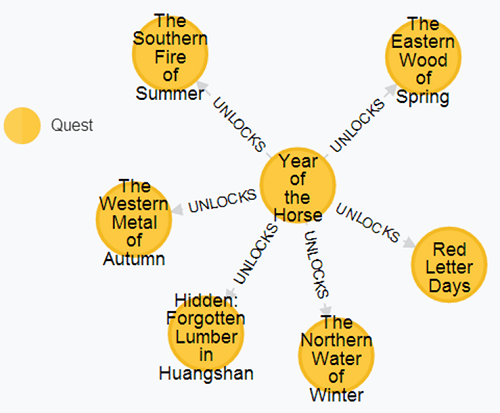
From the resulting graph, you can quickly see the quests that are unlocked by completing the Year of the Horse quest.
In fact, if you connect all the quests in the game then you’ll end up with the following.
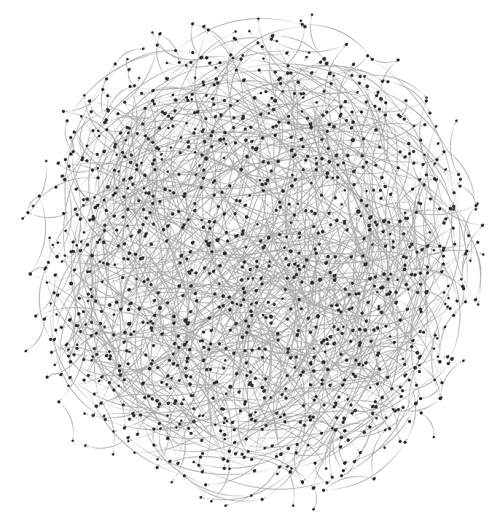
No wonder our game designers need a hand working with the data!
But, just being able to work out how quests are connected to each other and visualize them is not all that exciting or useful. We can do much more.
With our price model in full swing, we are able to:
- price baseline items based on factors such as scarcity
- price items that are derived from the baseline items
Since the price of an item reflects the difficulty in obtaining it, we can make use of the relationships between quests and items to “price” quests the same way – i.e. the more expensive the items a quest require, the more difficult that quest is to complete.
From there, you can establish simple rules such as:
- cheaper quests should come before more expensive ones, to ensure a sense of progression for the players
- a quest should not reward items whose total price exceeds the quest’s price
Monster Hierarchy
Finally, monster trapping is a big part of the game as its name suggests. As mentioned earlier, to catch a monster you need the right combination of bait and trap.
To catch a monster, sometimes you have to first catch a lower level monster; get its loot; and use the loot to make the bait for the monster you want to catch. Using the following relationships you can place the monsters into a hierarchy.
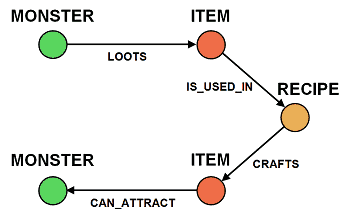
Which can be translated into the following Cypher query:
MATCH
(monster1:Monster)-[:LOOTS]->(loot)
-[r:IS_USED_IN | CRAFTS*0..]
->(bait)-[:CAN_ATTRACT]->(monster2)
RETURN monster1, monster2
Again, see how it mirrors our diagram?
Suppose we are on a quest to catch Bigfoot, we can use this query to identify the monsters we have to catch first in order to get the ingredients to make the bait for Bigfoot. The query yields the following result where the purple nodes are monsters and the red node in the middle is the recipe for crafting the Alluring Goat.
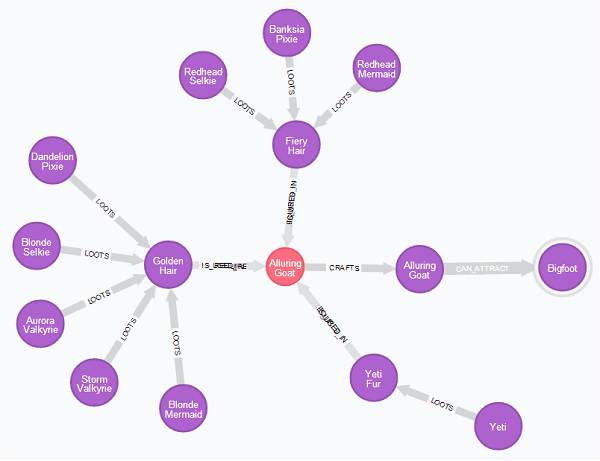
This places Bigfoot at the peak of its hierarchy.
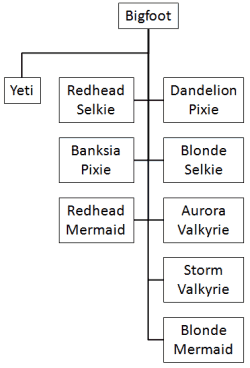
If you repeat the same exercise for every monster in the game and compose their hierarchies together, then you’ll end up with a more complete monster hierarchy covering most of the monsters that exist in the game.
Once we have both the quest hierarchy and monster hierarchy we can do some interesting analysis.
For instance, if completing Quest 1 unlocks Quest 2, and catching Monster 2 gives you the loot you need to make the bait for Monster 1:
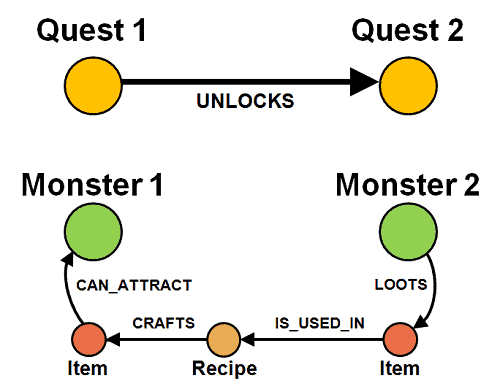
then Quest 1 cannot ask the player to catch Monster 1 if Quest 2 asks the player to catch Monster 2.
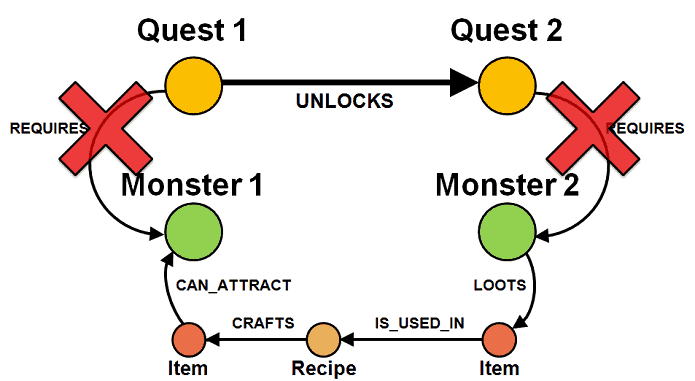
This is to ensure that we do not break the sense of progression as the player progresses through the quests.
Otherwise, as a player, you have to catch Monster 2 multiple times to get the loot to make the bait for Monster 1, and then take several attempts to successfully catch Monster 1. Just as you had finished with that cycle, the very next quest (or shortly after) you are asked to catch the same monster again, which doesn’t make for a very satisfying playing experience.
Remember, the situation might be even worse if you have to first catch other monsters in order to make the bait for Monster 2.
Even more Impact Analysis
We looked at how impact analysis applies to item pricing earlier, but we have another interesting use for impact analysis with regards to the monster hierarchy.
When you successfully catch a monster, you receive a gold reward from the Ministry of Monsters and a chance to get the monster’s loot.
Successful Catch = Gold + (maybe)Loot
Therefore, for monster catching, there’s an equation that needs to be balanced:
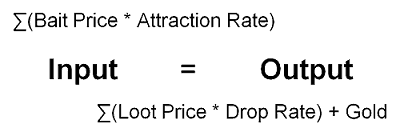
Whenever you change the price of an item that is either a bait or a loot, it can have a profound impact on the monster hierarchy:
- change to one side of the equation (item price, drop/attraction rate, gold reward) requires change to the other side to keep things in balance
- change to the input side of the equation requires changes to all preceding monsters in the hierarchy
- change to the output side requires changes to all subsequent monsters in the hierarchy
Thankfully, Neo4j makes this really easy, which is important because whenever we introduce a new monster (and it happens pretty regularly) it has an impact on all other monsters in the same region as there is a new competitor for food!
Conclusions
I hope I have given you a flavour of our use case with Neo4j. In general I find graph databases to be the most powerful and natural way to model a domain, especially for domains with complex and/or highly connected datasets.
Slides and Recording
Whenever you’re ready, here are 3 ways I can help you:
- Production-Ready Serverless: Join 20+ AWS Heroes & Community Builders and 1000+ other students in levelling up your serverless game. This is your one-stop shop for quickly levelling up your serverless skills.
- I help clients launch product ideas, improve their development processes and upskill their teams. If you’d like to work together, then let’s get in touch.
- Join my community on Discord, ask questions, and join the discussion on all things AWS and Serverless.
I was looking information about the purpose of graph databases… And found this.
This article is awesome, you made me excited about it.
Thank you Yan.
Thanks, glad I could help :-)
If you go to http://neo4j.com they have a list of use cases at the bottom of the page too, which includes the usual social network + fraud detection, etc.
Some of the impact analysis I did with Neo4j is very similar to those used in derivative pricing too, I know Credit Suisse is using Neo4j for that, and possibly others too.
Thanks for the post Yan.
Have you considered PostgreSQL??? Can you comment on your thought process for Neo4J vs PostgreSQL?
Thanks a bunch
Graph vs Relational
I haven’t used PostgreSQL before so can’t really comment on anything PostgreSQL specific, but as to why use a graph DB vs a relational DB, the choice was mainly down to the complexity of the model and the sort of query we want to run.
There are plenty of discussions on this comparison already, so I won’t repeat them here, but I find Jim Webber’s answer here to be a good high-level summary : http://stackoverflow.com/a/17942968
In general though, I think we should focus on what problems we are trying to solve and identify our constraints and challenges rather than trying to decide which paradigm is superior – they all each have their strength and weaknesses and depending on your particular use case one might be more appropriate than the other.
For instance, with our live user data, which has a high concurrency requirement (up to 25k reads + 25k writes per sec) but simple access pattern (key lookup 95% of the time), we use key-value stores with Amazon DynamoDB being our preferred choice. Whereas for analytics, we have different requirements and constraints, and we use Google BigQuery for that because it offers the best fit for those constraints and requirements.
Why Neo4j?
In our particular case, there are couple of reasons why I thought Neo4j was a good fit:
1. modelling the domain as they are (in the sense that nodes can have arbitrary properties and arbitrary relationships to any other node including itself, and that relationships can also have arbitrary properties that describe each instance) without having to first translate to the relational model removes many impedance mismatch I have experienced with RDBMS.
e.g. many relationships have arbitrary properties depending on the types of items being connected, then you’d have to model them as tables too (and depending on whether the DB is semi-schema’d you end up with all these nullable fields) and that complicates your query
2. cypher’s support for pattern matching allows me to express what I’m looking for very naturally. A simple example is the impact analysis above where I looked for both direct & indirect relationships between two items, and I could just map my doodling of the pattern I’m looking for into a 4-line cypher query!
If I have to constantly translate my mental model of the domain to the storage model in order to query my data (which is the whole point – I need to answer questions from the data) it makes it hard for me to think through the data as a medium and every thought exercise or attempt to discover interesting properties about it becomes laboured and time consuming (which also often introduces mistakes).
Neo4j vs other Graph DBs
As to Neo4j vs other graph DBs, several things factors into me choosing Neo4j:
1. we already use Neo4j as a company (in a different team) so there are existing operational expertise I can draw on when necessary
2. it’s the most mature graph DB solution available
3. this analysis happens statically so we don’t need the scalability of distributed graph DBs which comes with limitations on the complexity of queries you can perform
4. cypher is a very intuitive way to query graph data
(sorry this is a bit of a long-winded answer and not necessarily answer your question about PostgreSQL since I don’t have any experience with PostgreSQL, but I hope you find enough info about my thinking that led to Neo4j to answer your question)
Pingback: Bookmarks for May 30th through May 31st | Chris's Digital Detritus
Pingback: From the Community: May 2015 - Neo4j Graph Database
Pingback: DB Weekly No.60 | ENUE Blog
Pingback: Year in Review, 2015 | theburningmonk.com