
Yan Cui
I help clients go faster for less using serverless technologies.
AWS announced general availability of AWS Lambda support for AWS X-Ray back in May. It’s taken me a while to try it out, and whilst I see plenty of values I think its current limitations significantly restricts its usefulness in a complex system.
I found Lambda-specific documentations to be fragmented and I had to rely on experimentation and piece together clues from several sources:
- Lambda docs on using X-Ray
- X-Ray sample app which uses a mixture of Java and Nodejs
- X-Ray docs for Nodejs (not specific to Lambda)
- X-Ray SDK docs for Nodejs (not specific to Lambda)
I also found recording annotations and metadata didn’t work as advertised in the sample (although admittedly I could be doing something wrong…).
Update 03/07/2017 : after this post was published the folks at AWS got in touch and kindly cleared up some of the issues highlighted here which were caused by poor documentation which they’ll rectify in the near future. Scroll down to see the clarification on the relevant sections.
The Sample Application
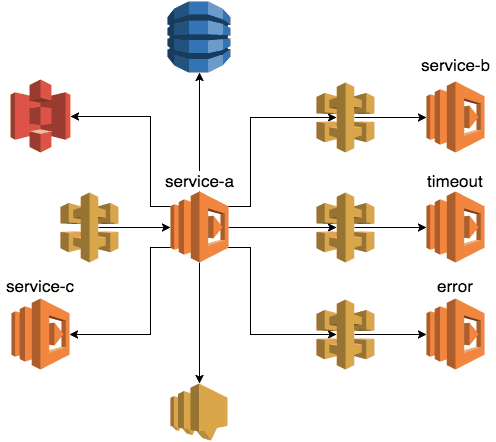
The sample project I created centres around a Lambda function called service-a, which in term calls a number of downstream systems:
- publishing to a SNS topic
- GET’ng and PUT’ng an object in S3
- GET’ng and PUT’ng a row in DynamoDB
- invoking another Lambda function (
service-c) using the Lambda API - making a HTTP request to an API Gateway endpoint backed by another Lambda function (one of
service-b,errorandtimeoutfunctions in the diagram above, which represents the success, error and timeout cases respectively)
// ... omitted for brevity

module.exports.handler = co.wrap(function* (event, context, callback) {
  console.log(JSON.stringify(event));
  console.log(JSON.stringify(context));

  global.hostname = event.headers.Host;
  global.accountId = event.requestContext.accountId;
  global.requestId = event.requestContext.requestId;

  let segment = AWSXRay.getSegment();
  console.log(JSON.stringify(segment));

  let n = Math.random() * 3;
  segment.addMetadata('random', `${n}`);      // this doesn't work
  segment.addAnnotation('path', event.path);  // this doesn't work

  if (n <= 1) {
    yield publishSNS(segment);
    yield accessS3(segment);
    yield accessDynamoDB(segment);
    yield invokeLambda(segment);
    let message = yield callServiceB(segment, n);
    const response = {
      statusCode: 200,
      body: JSON.stringify({
        message: `service-b says ${message}`
      }),
    };

    callback(null, response);
  } else if (n <= 2) {
    console.log("service-a is going to call the timeout endpoint");
    yield utils.request('GET', hostname, '/dev/demo/timeout');

    throw new Error("timed out");
  } else {
    console.log("service-a is going to call the error endpoint");
    yield utils.request('GET', hostname, '/dev/demo/error');

    throw new Error("boom");
  }
});
You can find all the source code here.
The Good
Once I figured out the magic incantations I was able to get the results I’m after. It took more time and energy than should have, but by and large most features worked as advertised at the first (or second) time of asking.
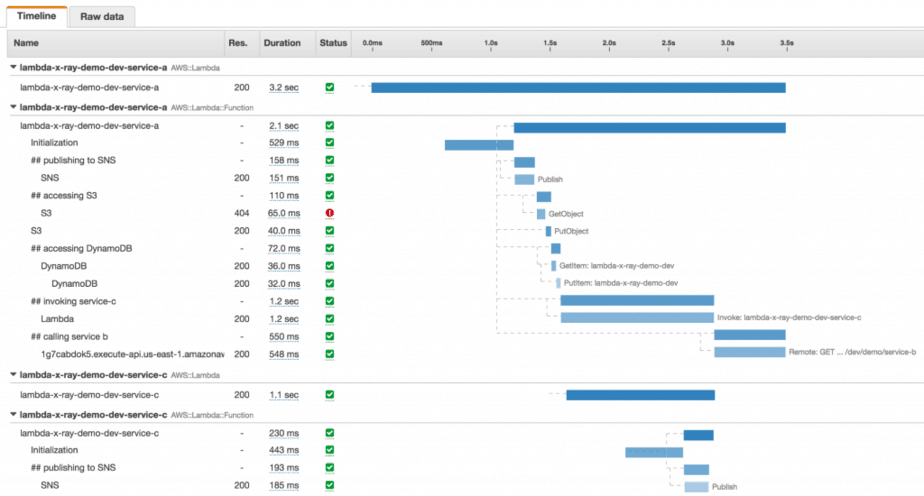
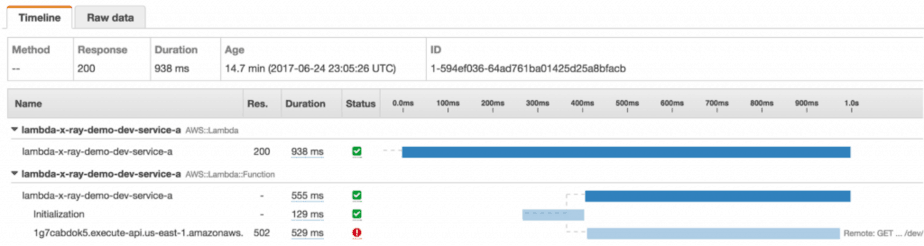
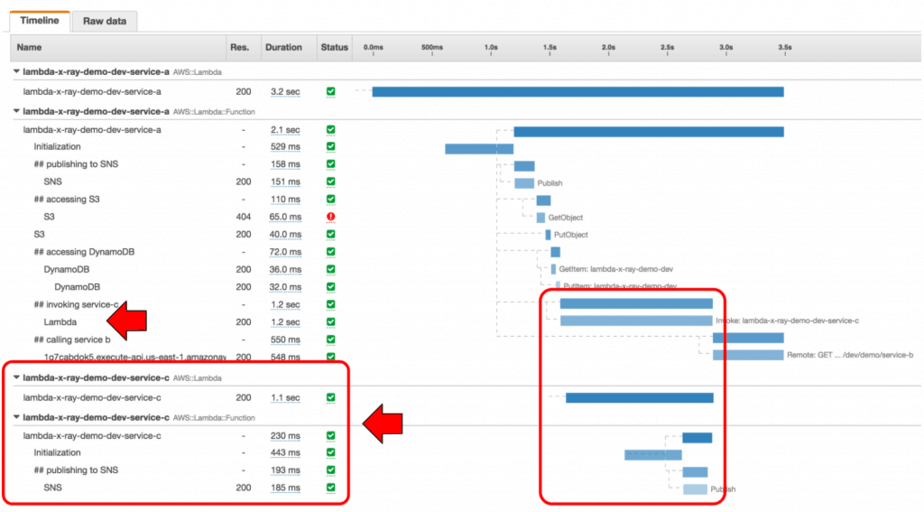
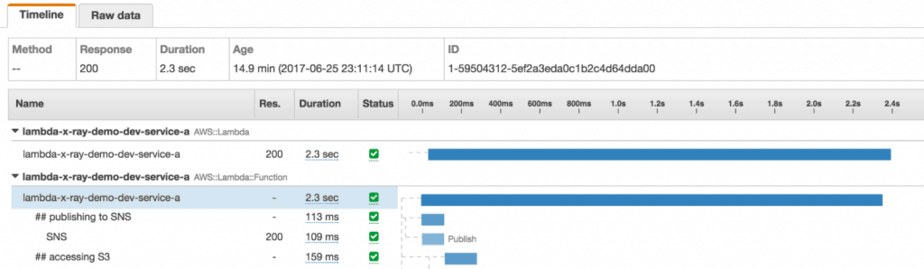
This is a trace of the service-a function, which includes the time it takes for Lambda to initialise the function, and the various downstream systems it talked to, all nested by under custom subsegments. It even includes the trace of the service-c function (and the time it spent publishing to SNS) which was invoked using the Lambda API.
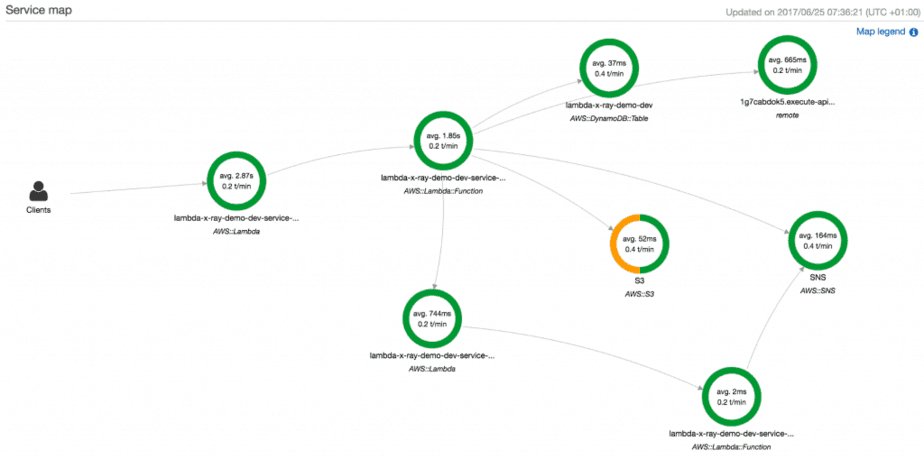
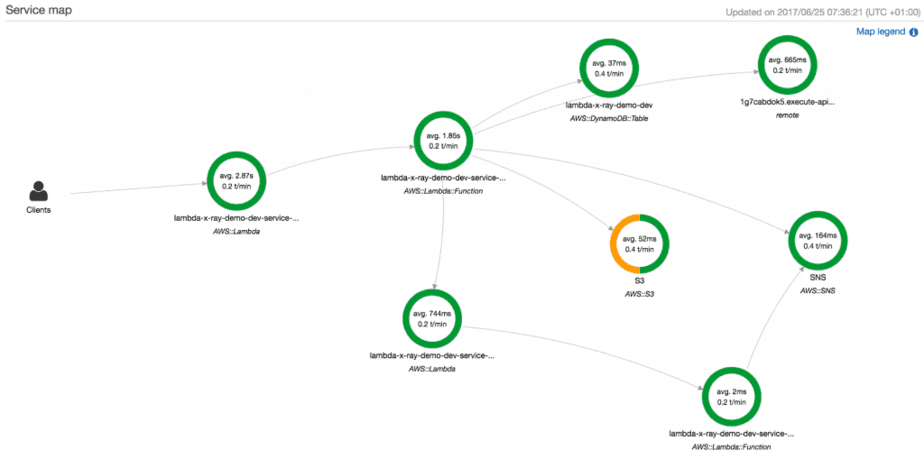
The service map for service-a includes service-c as a downstream dependency, as well as service-c’s dependency on SNS.
The Bad
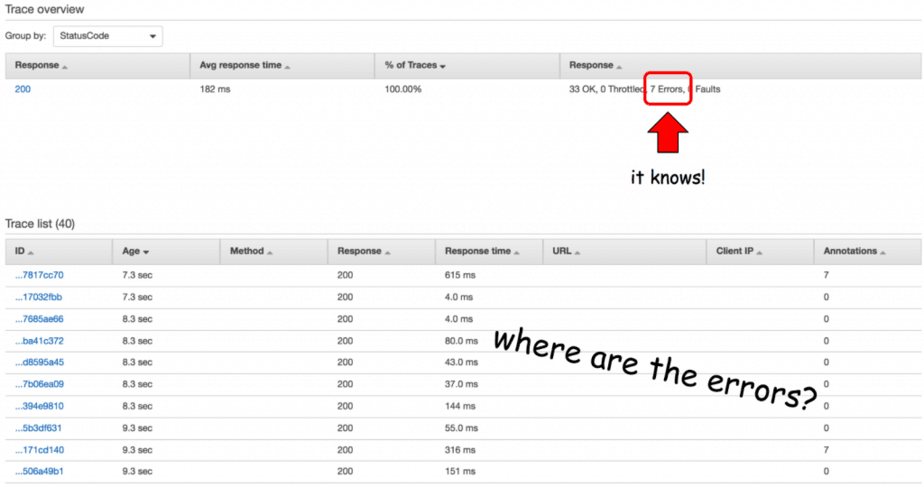
It’s always 200…
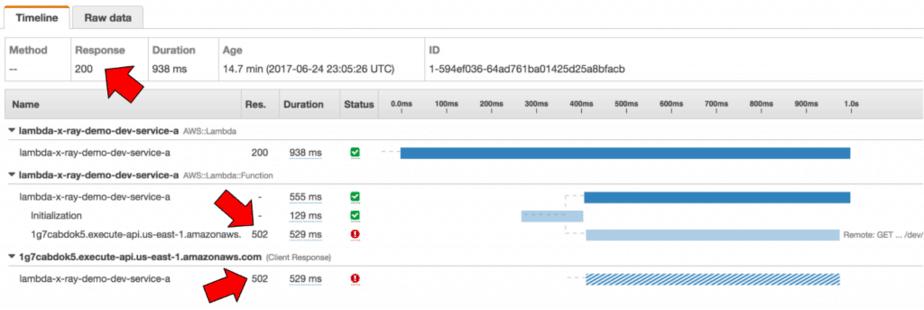
When the service-a function is invoked through its API Gateway endpoint and errors, the corresponding trace still reports a 200 response code.
Presumably what X-Ray sees is a 200 response from the Lambda service whose payload indicates a 502 response to the API Gateway invocation and so it thought “hey, it’s a 200!”.
Here, I can see the service-a endpoint returned a 502 in Postman..
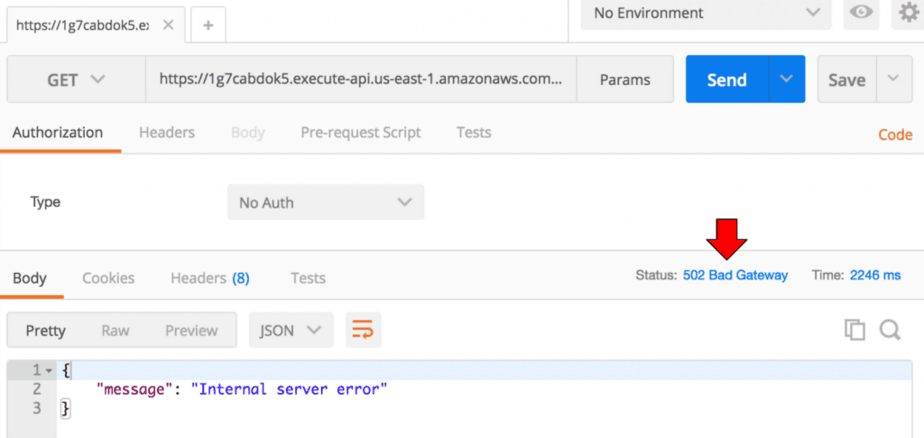
..but the trace reported a 200 response code.
Oddly enough, the trace for the error function also reports a 200 even though its own status field indicates it had errored.
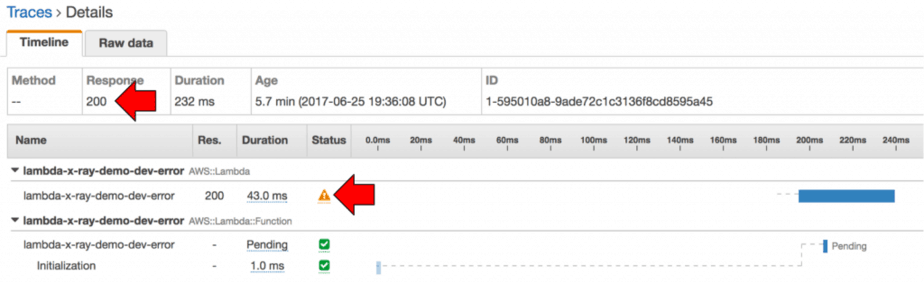
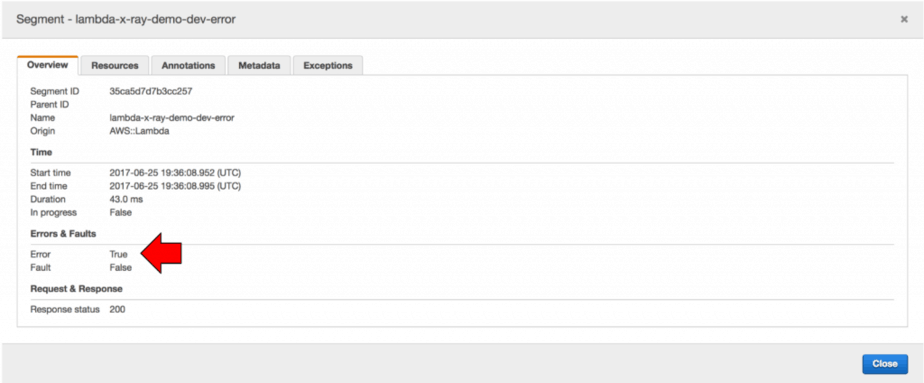
This behaviour is both confusing and inconsistent to me, perhaps I have misunderstood how it works. Sadly, the X-Ray’s concepts page also does not explain the difference between an Error and a Fault…
Whilst this might seem like a small nuisance now, the inability to quickly identify error traces will hurt you most when you need to diagnose problems in production, possibly when you’re under the most time pressure.
Update 03/07/2017 : AWS confirmed that the reason the errors are reported as 200 is due to Lambda service returning a 200 response (with payload that indicates an error). One workaround is to use the filter expression service() { fault } which returns all traces that contains a fault.
Traces don’t span over API Gateway
When the service-a function makes an outgoing HTTP request to an API Gateway endpoint the trace stops at the API Gateway endpoint and doesn’t extend to the Lambda functions that are triggered by API Gateway.
This behaviour was consistent with all 3 endpoints I tested—service-b, error and timeout.
For this test, I have followed the X-Ray documentation and used the X-Ray SDK to wrap the Nodejs https module when making the HTTP request.
'use strict';

const AWSXRay = require('aws-xray-sdk');
const https   = AWSXRay.captureHTTPs(require('https'));

console.log(AWSXRay);

let request = (method, hostname, path) => {
  const options = { hostname, port: 443, path, method };

  let promise = new Promise((resolve, reject) => {
    const req = https.request(options, res => {
      console.log('statusCode:', res.statusCode);
      console.log('headers:', res.headers);

      res.on('data', buffer => resolve(buffer.toString('utf8')));
    });

    req.on('error', err => reject(err));

    req.end();
  });

  return promise;
}

module.exports = {
  request
};
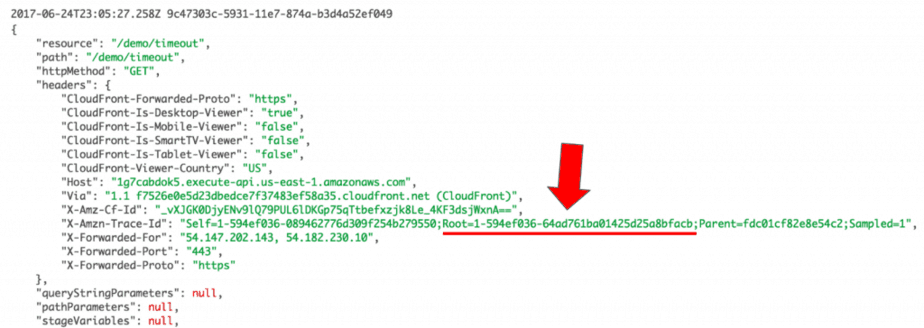
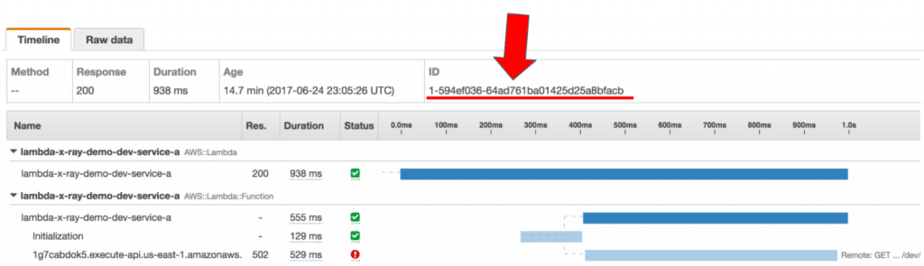
I can see the trace IDs are correctly passed along in the outgoing HTTP request and received by the handling Lambda function.
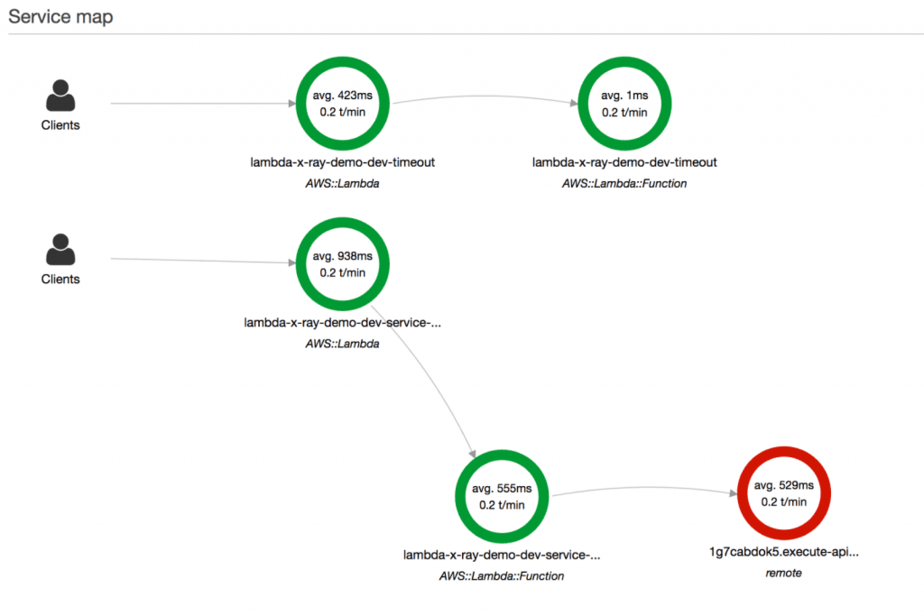
This is the service map I expected to see in this case—where service-a’s trace follows through the HTTP request to API Gateway and includes the invocation of the timeout function.
ps. this is not an actual screenshot, it’s an image I composed together to show what I expected to see!
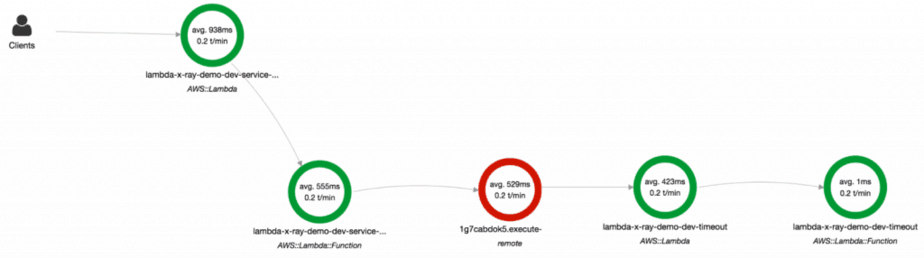
Instead, the actual service map stops at the API Gateway.
However, when invoking another Lambda function directly (using the Lambda API and wrapped AWS SDK) the trace worked as expected.
Perhaps the limitation lies with API Gateway?
The Ugly
No sampling
According to the Lambda’s documentation on X-Ray, requests should be sampled at 1 request per minute.
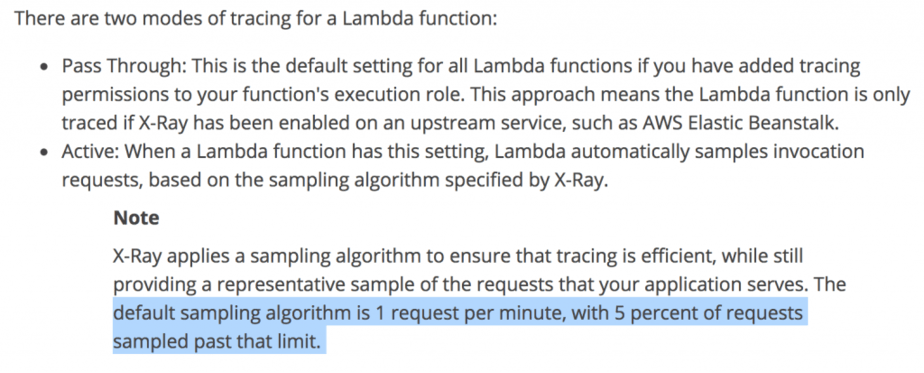
However, that wasn’t the case in my experiments. EVERY request was sampled, as you can see from the Age of the traces in the screenshot below.
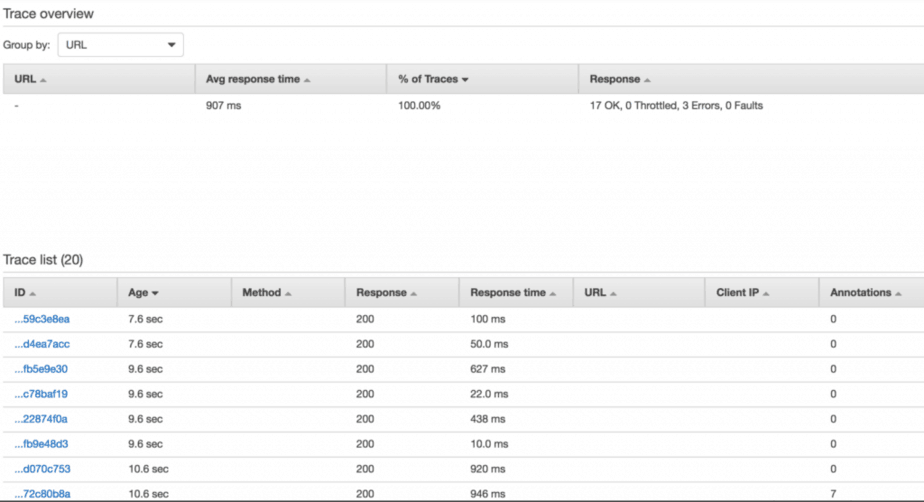
This behaviour was consistent when invoking Lambda via API Gateway as well as via the Lambda management console.
Whilst the X-Ray service is not expensive per se—$5.00 per million traces—it’s nonetheless a cost that can easily spring up on you if you are unwillingly tracing every request through your system. As an example, I worked on a moderately successful social game at Gamesys with ~1M DAU. At roughly 250M user requests per day, X-Ray would have cost $5 * 250 * 30 days = $37500, which was more than our entire AWS bill at the time!
Update 03/07/2017 : this turns out to be a problem with the documentation, which doesn’t mention that sampling is volume-based and only kicks in once you reach a certain volume of requests/s.
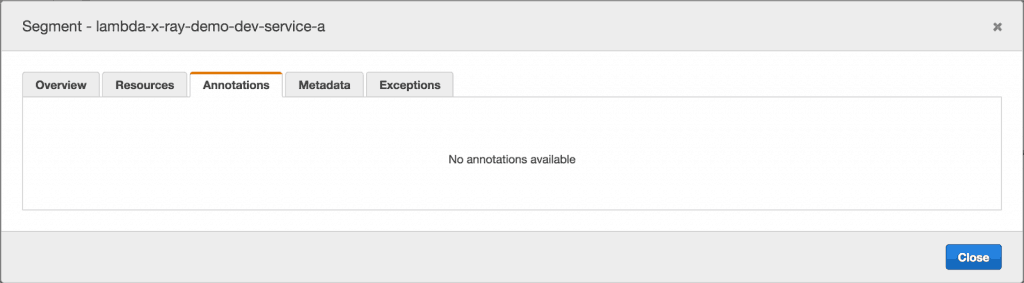
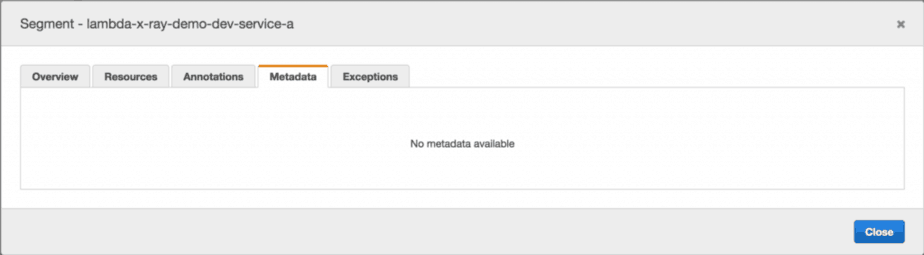
Annotations and Metadata only work on subsegments
The one thing that just refused to work (even though I have followed the examples) was adding annotation and metadata to the root segment:
module.exports.handler = (event, context, callback) => {
  ...
  let segment = AWSXRay.getSegment();
  let n = Math.random() * 3;
  segment.addMetadata('random', `${n}`);      // this doesn't work
  segment.addAnnotation('path', event.path);  // this doesn't work
  ...
}
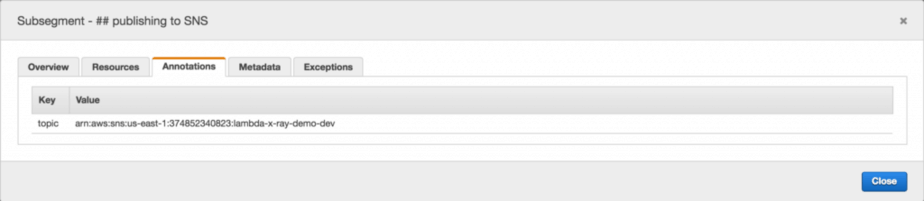
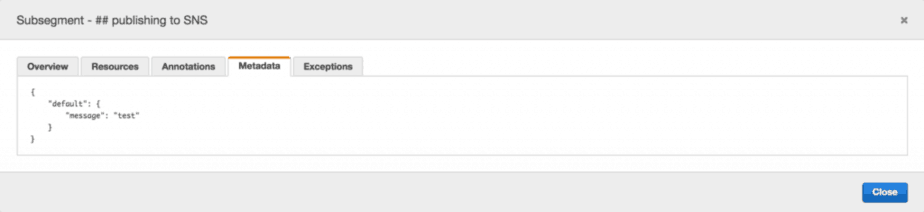
Interestingly, adding annotations and metadata to subsegments works just fine.
let publishSNS = segment => {
  return new Promise((resolve, reject) => {
    console.log('publishing to SNS topic');

    let f = co.wrap(function* (subsegment) {
      ...
      subsegment.addAnnotation('topic', topicArn);
      subsegment.addMetadata('message', 'test');

      let req = {
        Message: message,
        TopicArn: topicArn
      };
      yield sns.publishAsync(req);

      subsegment.close();
      resolve();
    });

    AWSXRay.captureAsyncFunc("## publishing to SNS", f, segment);
  });
};
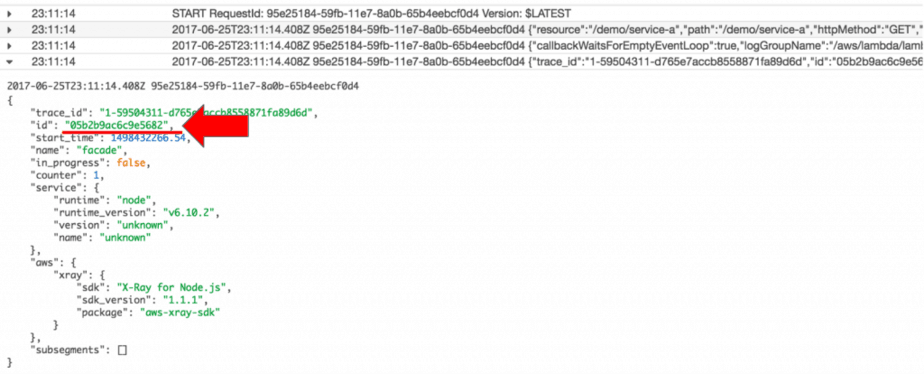
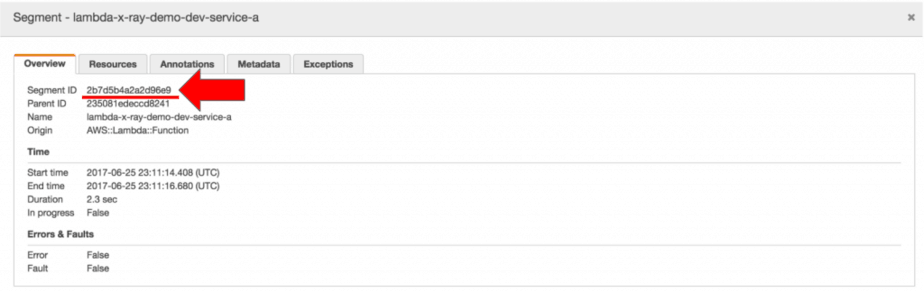
Looking at the logs, I found something interesting: the segment ID for the root segment doesn’t match the segment ID in the X-Ray trace.
For instance, I fetch the root segment for my function in the handler and logs it to CloudWatch Logs.
const AWSXRay = require('aws-xray-sdk');
module.exports.handler = (event, context, callback) => {
  ...
  // this should be the root segment for my function
  let segment = AWSXRay.getSegment();
  console.log(JSON.stringify(segment));
  ...
}
In the logs I can see the segment ID is 05b2b9ac6c9e5682.
But in the X-Ray trace, the segment ID for the root segment is 2b7d5b4a2a2d96e9.
Furthermore, the trace ID is also different:
- in the logs it’s 1–59504311-d765e7accb8558871fa89d6d
- in the X-Ray console it’s 1–59504312–5ef2a3eda0c1b2c4d64dda00
This was very odd, so I decided to track the trace ID in the logs vs in the X-Ray console, starting with a coldstart.
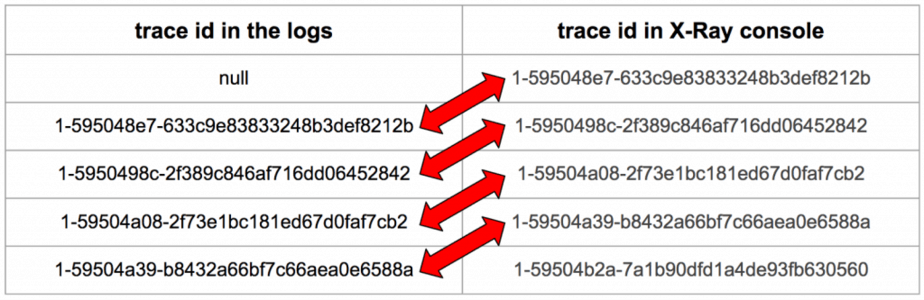
Bingo! Looks like it’s a bug in the X-Ray SDK for Nodejs where AWSXray.getSegment() returns the root segment from the previous invocation..
Update 03/07/2017 : whilst there was a bug in the X-Ray SDK wrt tracking the trace-id, adding annotations and metadata to the root segment is simply not supported, which the doc doesn’t explicitly state. You can work around this by creating a subsegment that covers the entire span of your function invocation to act as your custom root segment and attach any annotation and metadata related to the invocation there.
Conclusion
So there you have it, my weekend escapade with AWS X-Ray and Lambda :-)
Overall I’m impressed with what I saw, and feel X-Ray would have added a lot of value to the serverless architecture I was building at Yubl. However, the inability to span traces over API Gateway endpoints makes it a far less useful addition to our ecosystem.
Furthermore, the X-Ray service is focused on execution time and helping you identify performance bottlenecks. However, there’s another important aspect to distributed tracing—helping you debug your system by ensuring a set of correlation IDs are captured in all log messages. X-Ray does not concern itself with this, although you can probably use the trace ids X-Ray provides you with it’s still up to you to capture them in all log messages and propagating all your logs to one easily searchable place. We invested some effort into enabling distributed tracing in our serverless architecture at Yubl, which you can read about in detail in this post.
Are you using X-Ray in production? I’d love to hear your thoughts and feedbacks on the service, and any pitfalls to look out for.
Whenever you’re ready, here are 3 ways I can help you:
- Production-Ready Serverless: Join 20+ AWS Heroes & Community Builders and 1000+ other students in levelling up your serverless game. This is your one-stop shop to level up your serverless skills quickly.
- Do you want to know how to test serverless architectures with a fast dev & test loop? Check out my latest course, Testing Serverless Architectures and learn the smart way to test serverless.
- I help clients launch product ideas, improve their development processes and upskill their teams. If you’d like to work together, then let’s get in touch.