
Yan Cui
I help clients go faster for less using serverless technologies.
The common practice of using agents/daemons to buffer and batch send logs and metrics are no longer applicable in the world of serverless. Here are some tips to help you get the most out of your logging and monitoring infrastructure for your functions.
This is part 2 of a 3-part mini series on managing your AWS Lambda logs.
If you haven’t read part 1 yet, please give it a read now. We’ll be building on top of the basic infrastructure of shipping logs from CloudWatch Logs detailed in that post.
part 1 : centralise logging
part 3 : tracking correlation IDs
New paradigm, new problems
Much have changed with the serverless paradigm, and it solves many of the old problems we face and replaced them with some new problems that (I think) are easier to deal with.
Consequently, many of the old practices are no longer applicable – eg. using agents/daemons to buffer and batch send metrics and logs to monitoring and log aggregation services. However, even as we throw away these old practices for the new world of serverless, we are still after the same qualities that made our old tools “good”:
- able to collect rich set of system and application metrics and logs
- publishing metrics and logs should not add user-facing latency (ie. they should be performed in the background)
- metrics and logs should appear in realtime (ie. within a few seconds)
- metrics should be granular
Unfortunately, the current tooling for Lambda – CloudWatch metrics & CloudWatch Logs – are failing on a few of these, some more so than others:
- publishing custom metrics requires additional network calls that need to be made during the function’s execution, adding to user-facing latency
- CloudWatch metrics for AWS services are only granular down to 1 minute interval (custom metrics can be granular down to 1 second)
- CloudWatch metrics are often a few minutes behind (though custom metrics might have less lag now that they can be recorded at 1 second interval)
- CloudWatch Logs are usually more than 10s behind (not precise measurement, but based on personal observation)
With Lambda, we have to rely on AWS to improve CloudWatch in order to bring us parity with existing “server-ful” services.
Many vendors have announced support for Lambda, such as Datadog and Wavefront. However, as they are using the same metrics from CloudWatch they will have the same lag.
IOPipe is a popular alternative for monitoring Lambda functions and they do things slightly differently – by giving you a wrapper function around your code so they can inject monitoring code (it’s a familiar pattern to those who have used AOP frameworks in the past).
For their 1.0 release they also announced support for tracing (see the demo video below), which I think it’s interesting as AWS already offers X-Ray and it’s a more complete tracing solution (despite its own shortcomings as I mentioned in this post).

IOPipe seems like a viable alternative to CloudWatch, especially if you’re new to AWS Lambda and just want to get started quickly. I can totally see the value of that simplicity.
However, I have some serious reservations with IOPipe’s approach:
- A wrapper around every one of my functions? This level of pervasive access to my entire application requires a serious amount of trust that has to be earned, especially in times like this.
- CloudWatch collects logs and metrics asynchronously without adding to my function’s execution time. But with IOPipe they have to send the metrics to their own system, and they have to do so during my function’s execution time and hence adding to user-facing latency (for APIs).
- Further to the above points, it’s another thing that can cause my function to error or time out even after my code has successfully executed. Perhaps they’re doing something smart to minimise that risk but it’s hard for me to know for sure and I have to anticipate failures.
Of all the above, the latency overhead is the biggest concern for me. Between API Gateway and Lambda I already have to deal with cold start and the latency between API Gateway and Lambda. As your microservice architecture expands and the no. of inter-service communications grows, these latencies will compound further.
For background tasks this is less a concern, but a sizeable portion of Lambda functions I have written have to handle HTTP requests and I need to keep the execution time as low as possible for these functions.
Sending custom metrics asynchronously
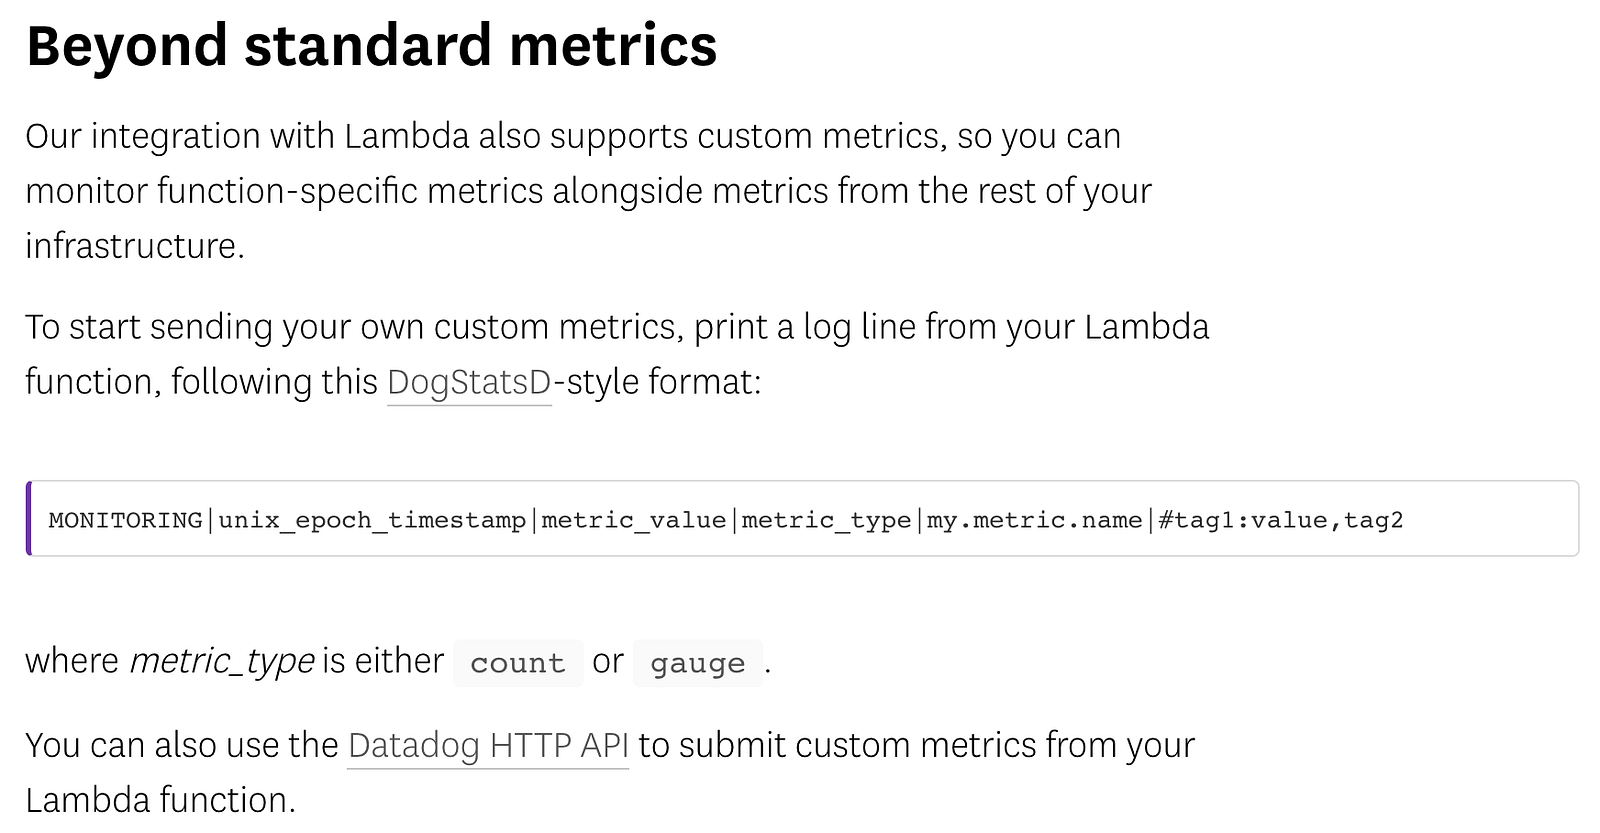
I find Datadog’s approach for sending custom metrics very interesting. Essentially you write custom metrics as specially-formatted log messages that Datadog will process (you have to set up IAM permissions for CloudWatch to call their function) and track them as metrics.
It’s a simple and elegant approach, and one that we can adopt for ourselves even if we decide to use another monitoring service.
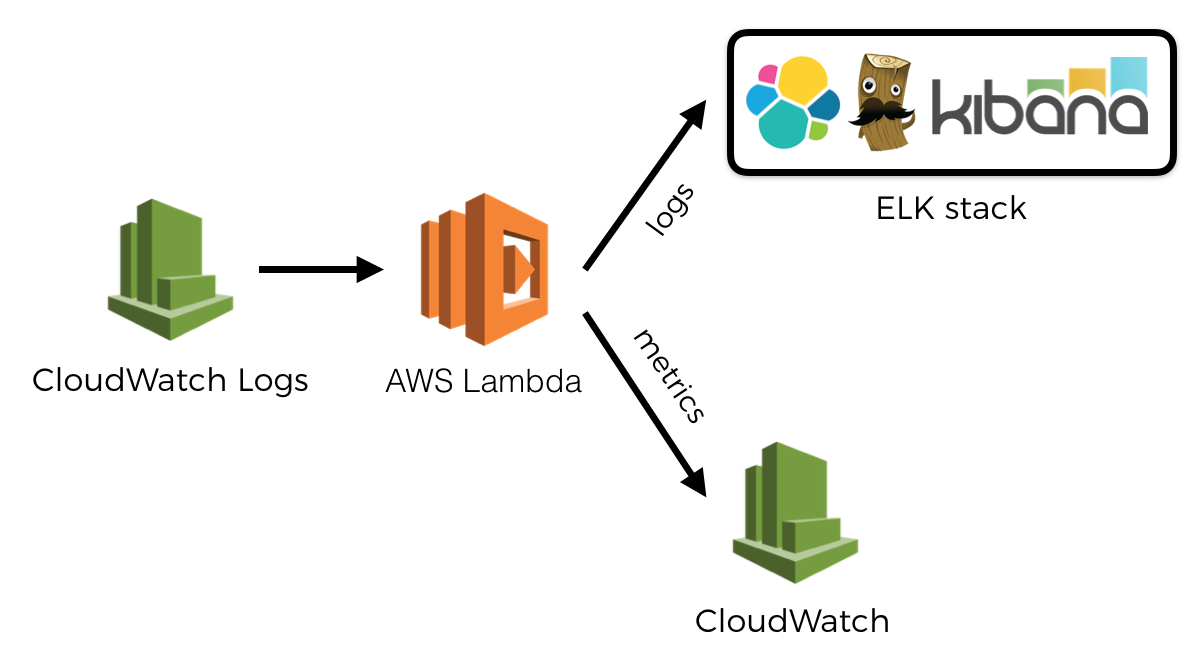
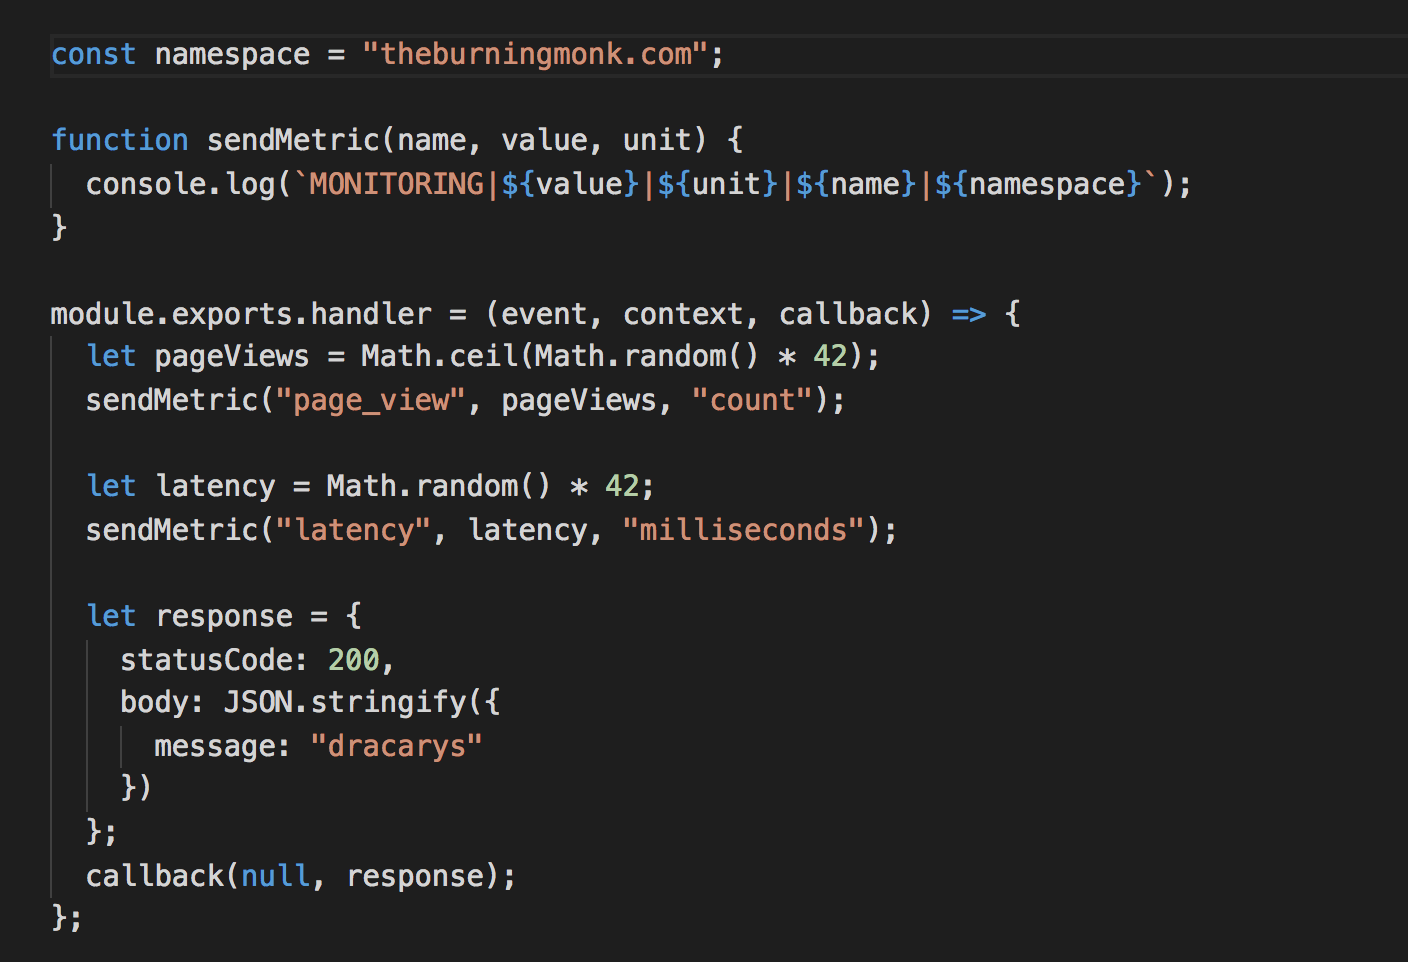
In part 1 we established an infrastructure to ship logs from CloudWatch Logs to a log aggregation service of our choice. We can extend the log shipping function to look for log messages that look like these:
For these log messages, we will interpret them as:
MONITORING|metric_value|metric_unit|metric_name|metric_namespace
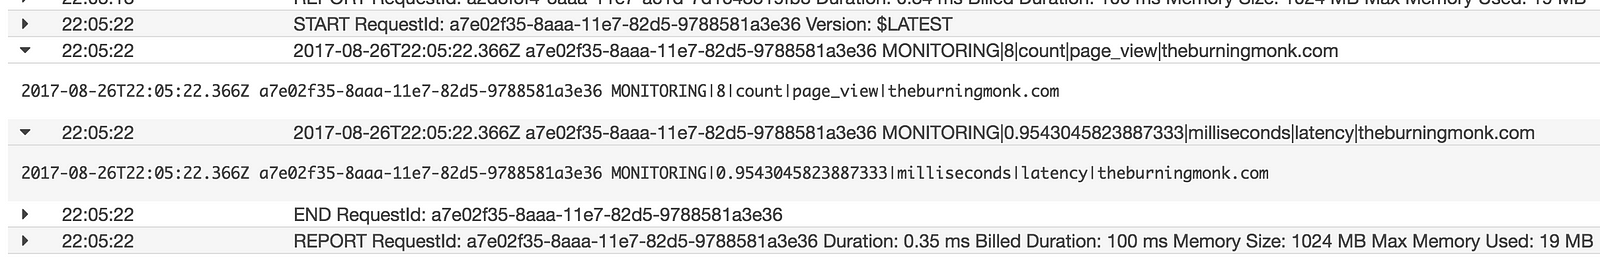
And instead of sending them to the log aggregation service, we’ll send them as metrics to our monitoring service instead. In this particular case, I’m using CloudWatch in my demo (see link below), so the format of the log message reflects the fields I need to pass along in the PutMetricData call.
To send custom metrics, we write them as log messages. Again, no latency overhead as Lambda service collects these for us and sends them to CloudWatch in the background.
And moments later they’re available in CloudWatch metrics.
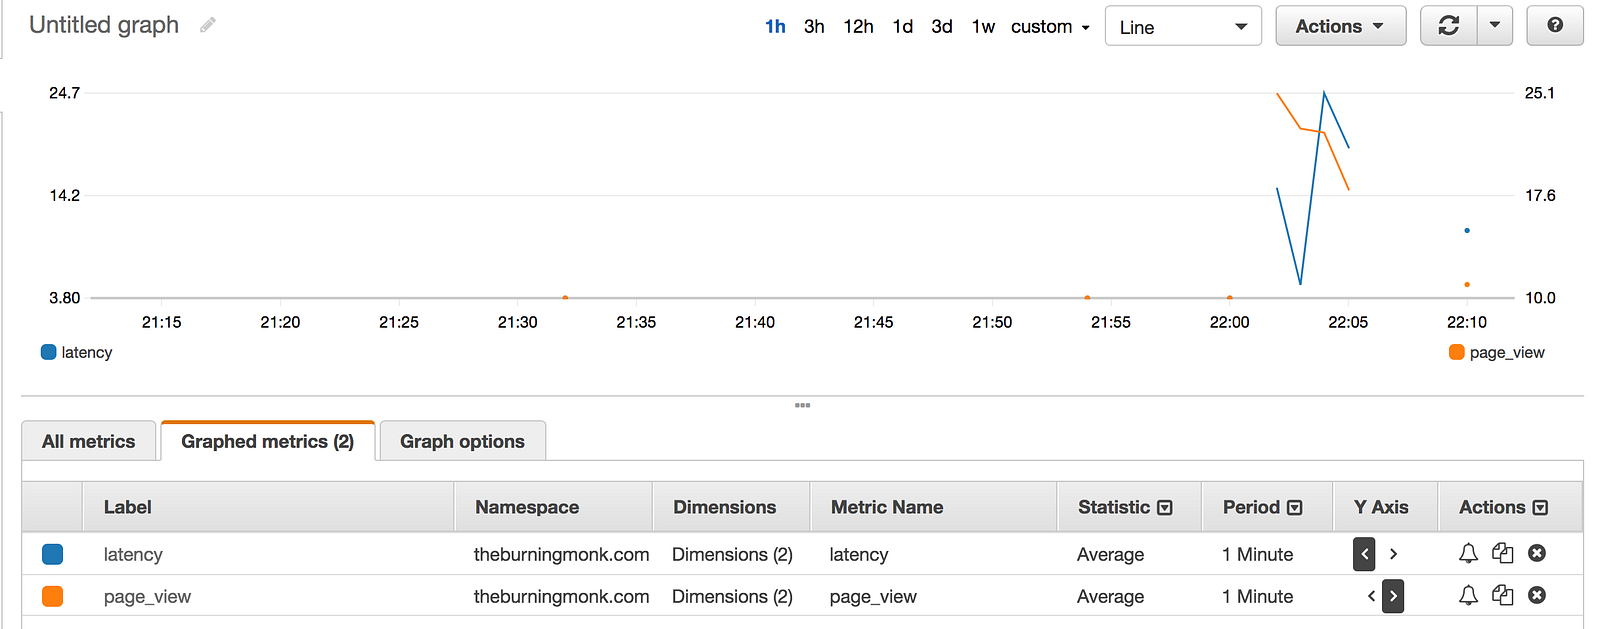
Take a look at the custom-metrics function in this repo.
Tracking the memory usage and billed duration of your AWS Lambda functions in CloudWatch
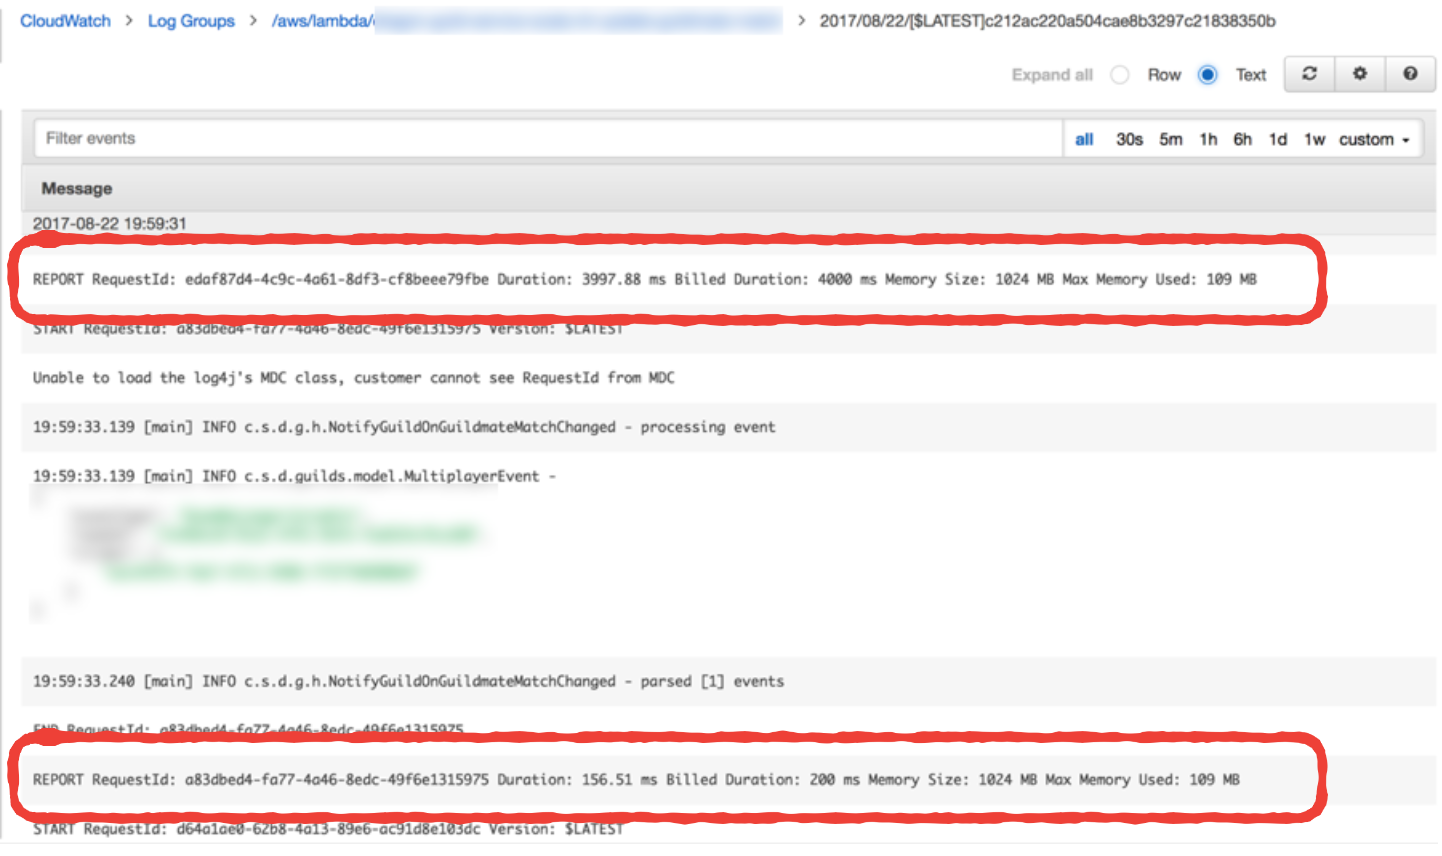
Lambda reports the amount of memory used, and the billed duration at the end of every invocation. Whilst these are not published as metrics in CloudWatch, you can find them as log messages in CloudWatch Logs.
I rarely find memory usage to be an issue as Nodejs functions have such a small footprint. My choice of memory allocation is primarily based on getting the right balance between cost and performance. In fact, Alex Casalboni of CloudAcademy wrote a very nice blog post on using Step Functions to help you find that sweet spot.
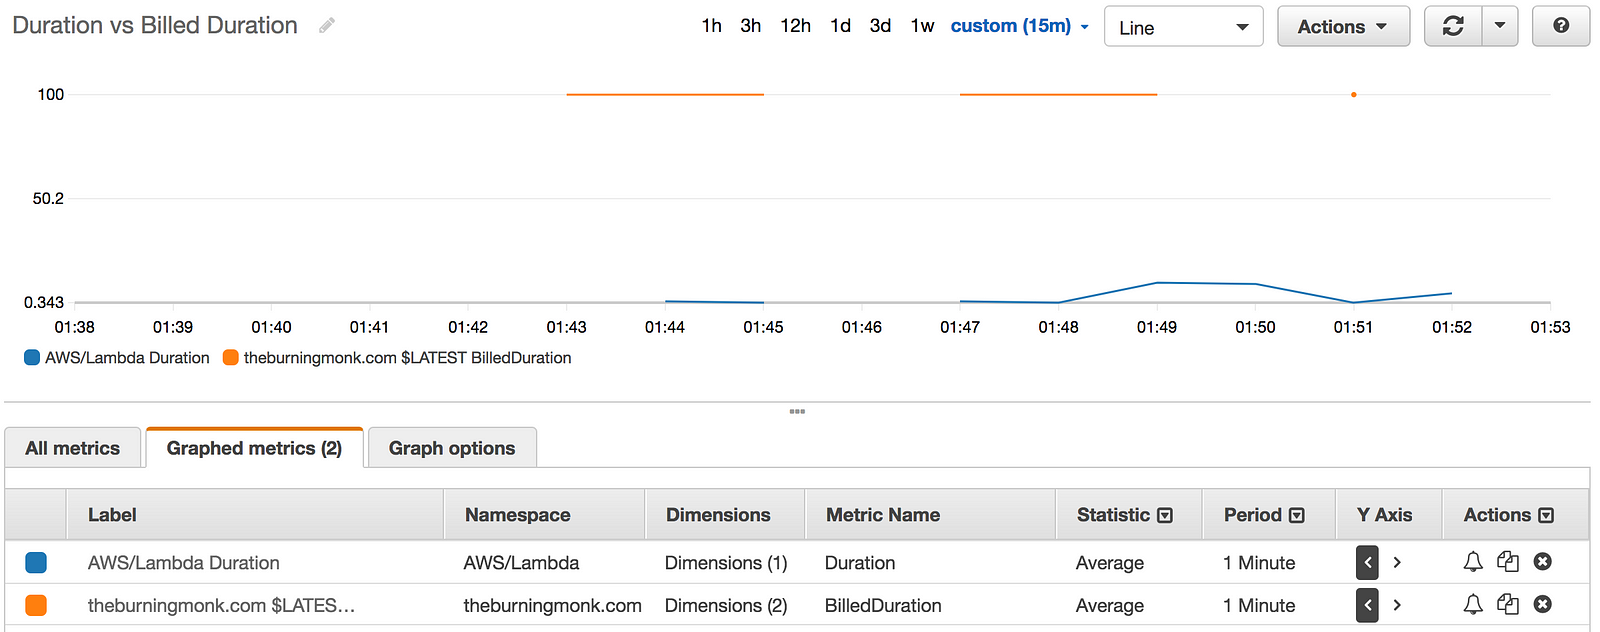
The Billed Duration on the other hand, is a useful metric when viewed side by side with Invocation Duration. It gives me a rough idea of the amount of wastage I have. For example, if the average Invocation Durationof a function is 42ms but the average Billed Duration is 100ms, then there is a 58% wastage and maybe I should consider running the function on a lower memory allocation.
Interestingly, IOPipe records these in their dashboard out of the box.
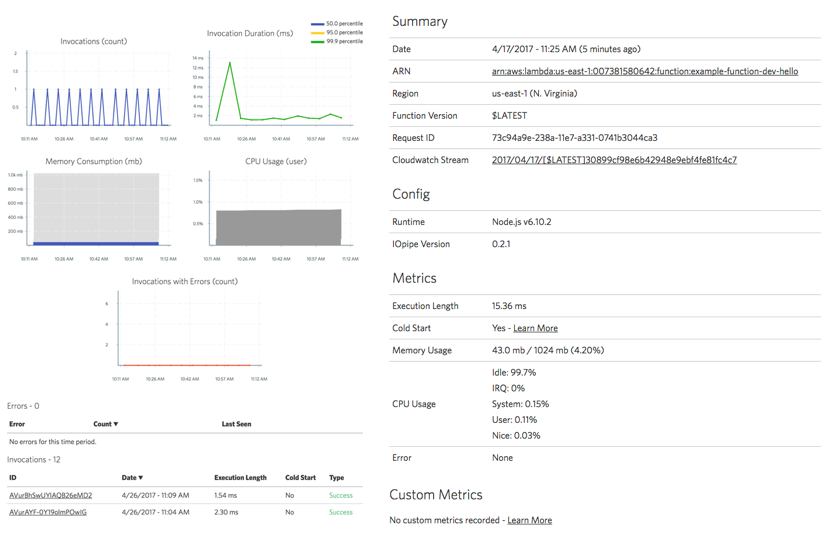
However, we don’t need to add IOPipe just to get these metrics. We can apply a similar technique to the previous section and publish them as custom metrics to our monitoring service.
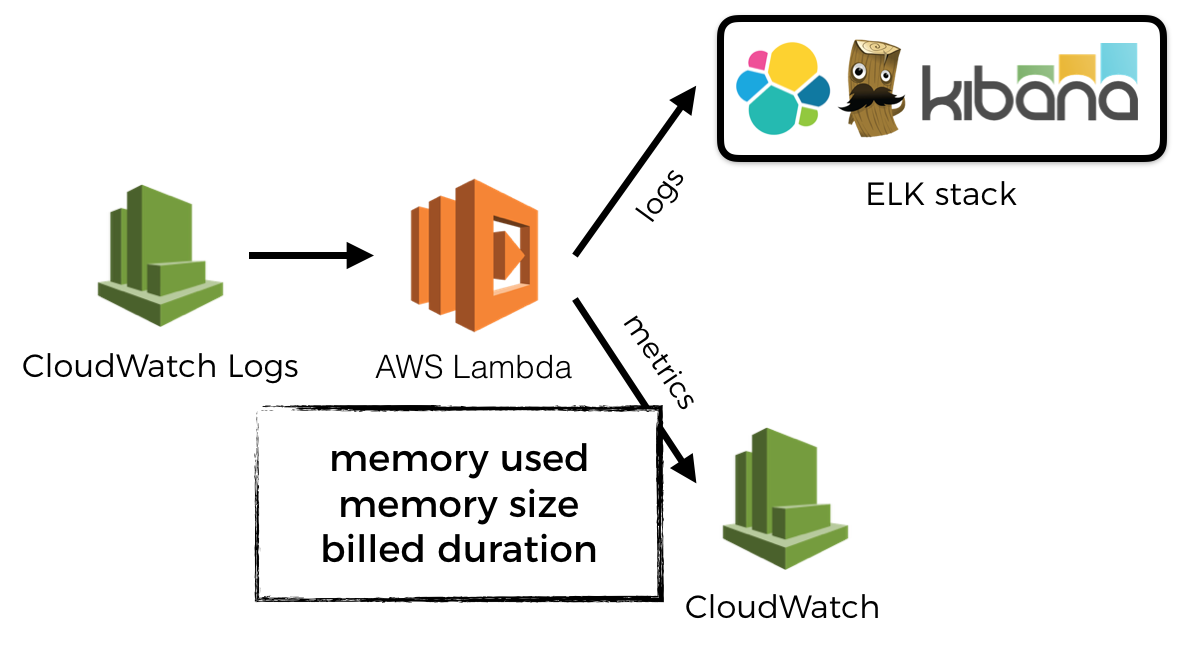
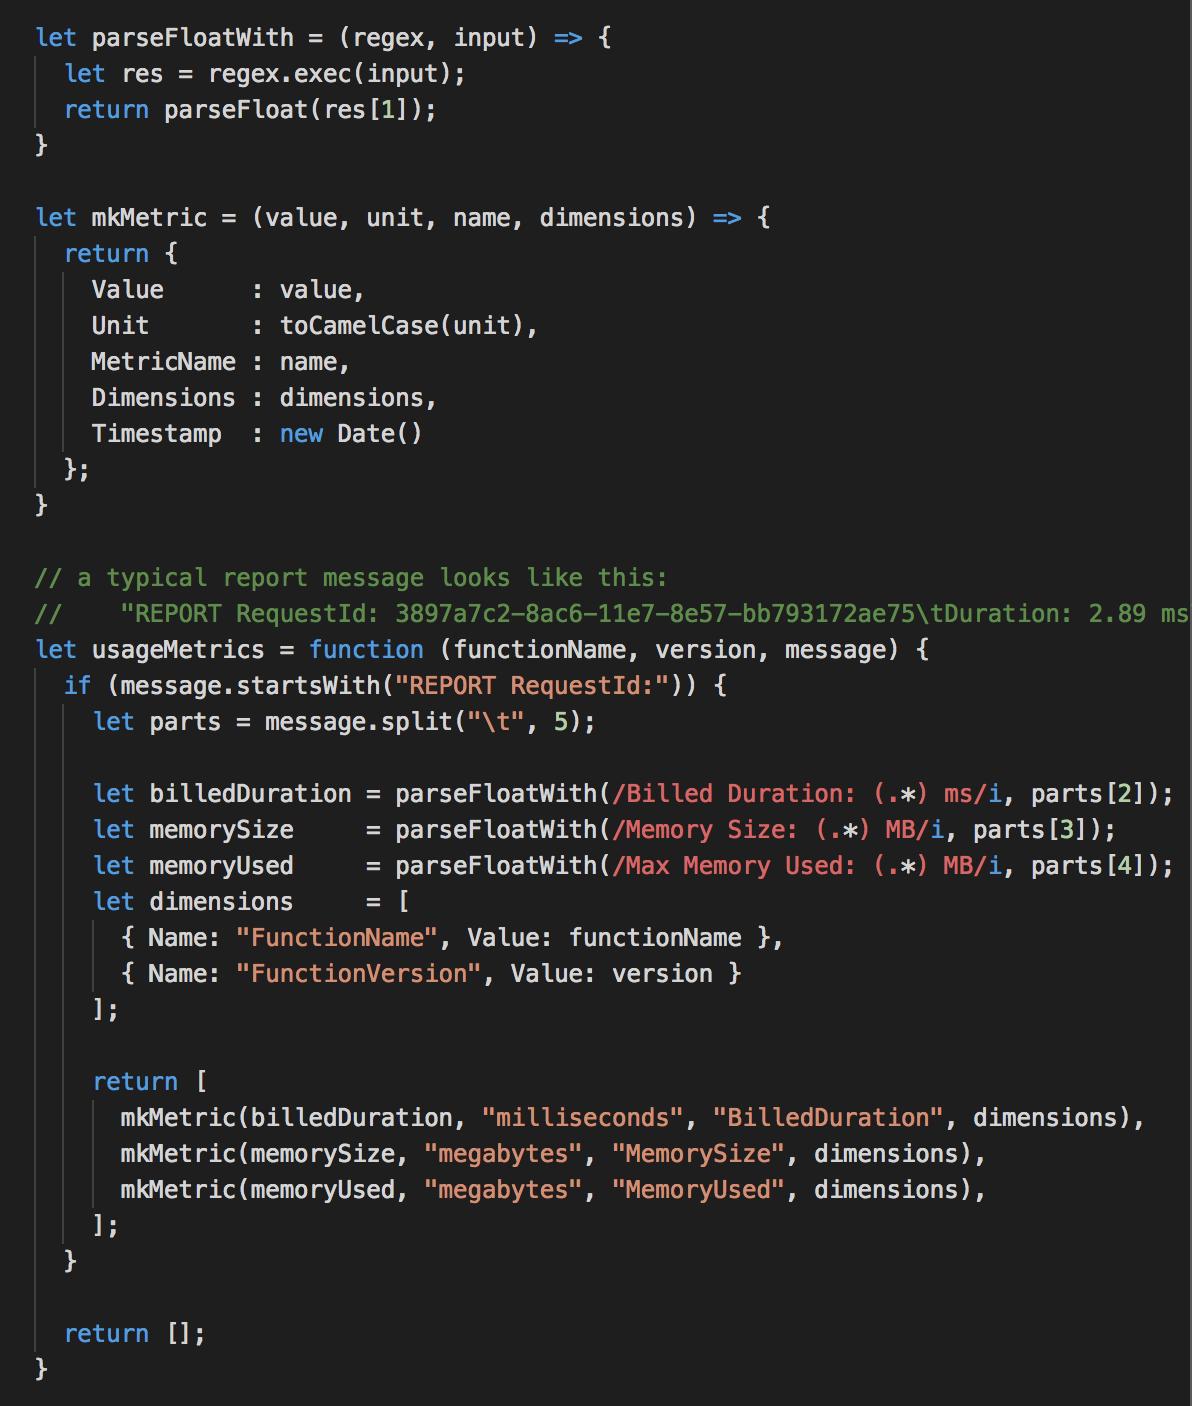
To do that, we have to look out for these REPORT log messages and parse the relevant information out of them. Each message contains 3 pieces of information we want to extract:
- Billed Duration (Milliseconds)
- Memory Size (MB)
- Memory Used (MB)
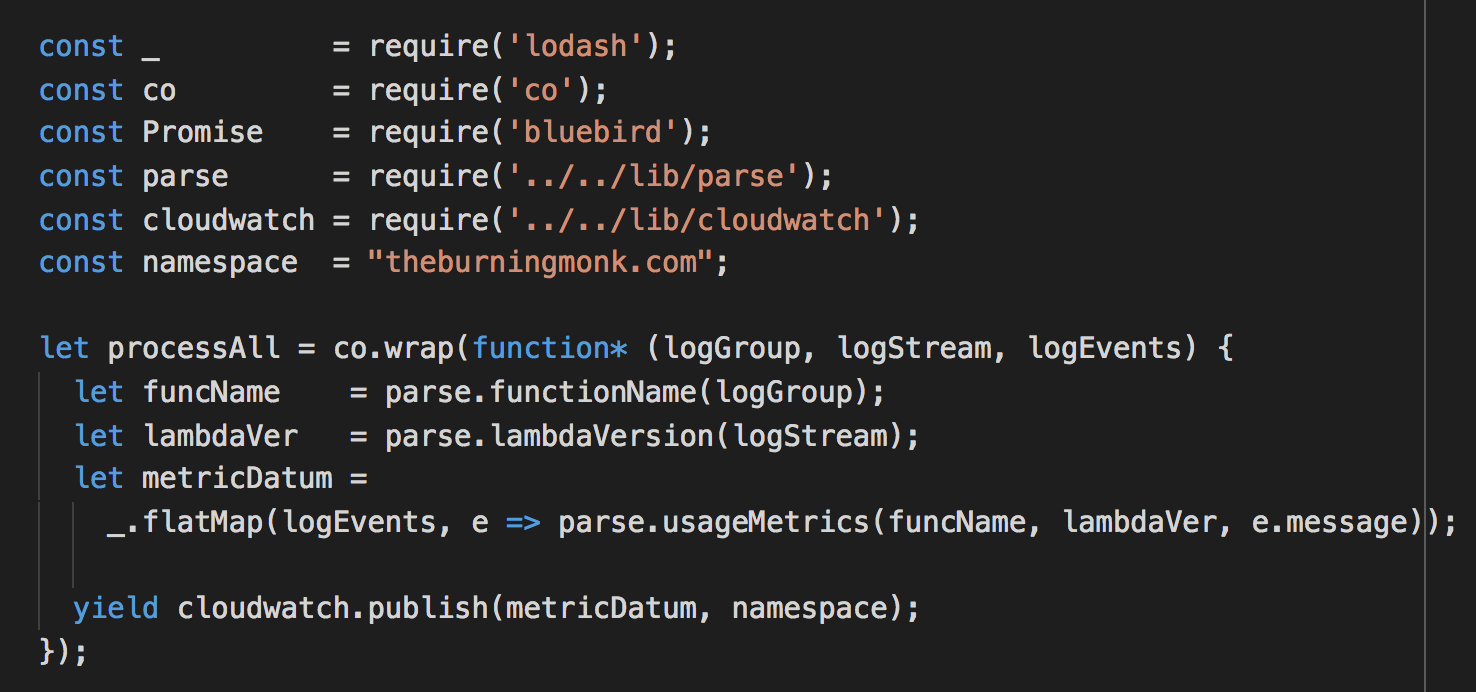
We will parse these log messages and return an array of CloudWatch metric data for each, so we can flat map over them afterwards.
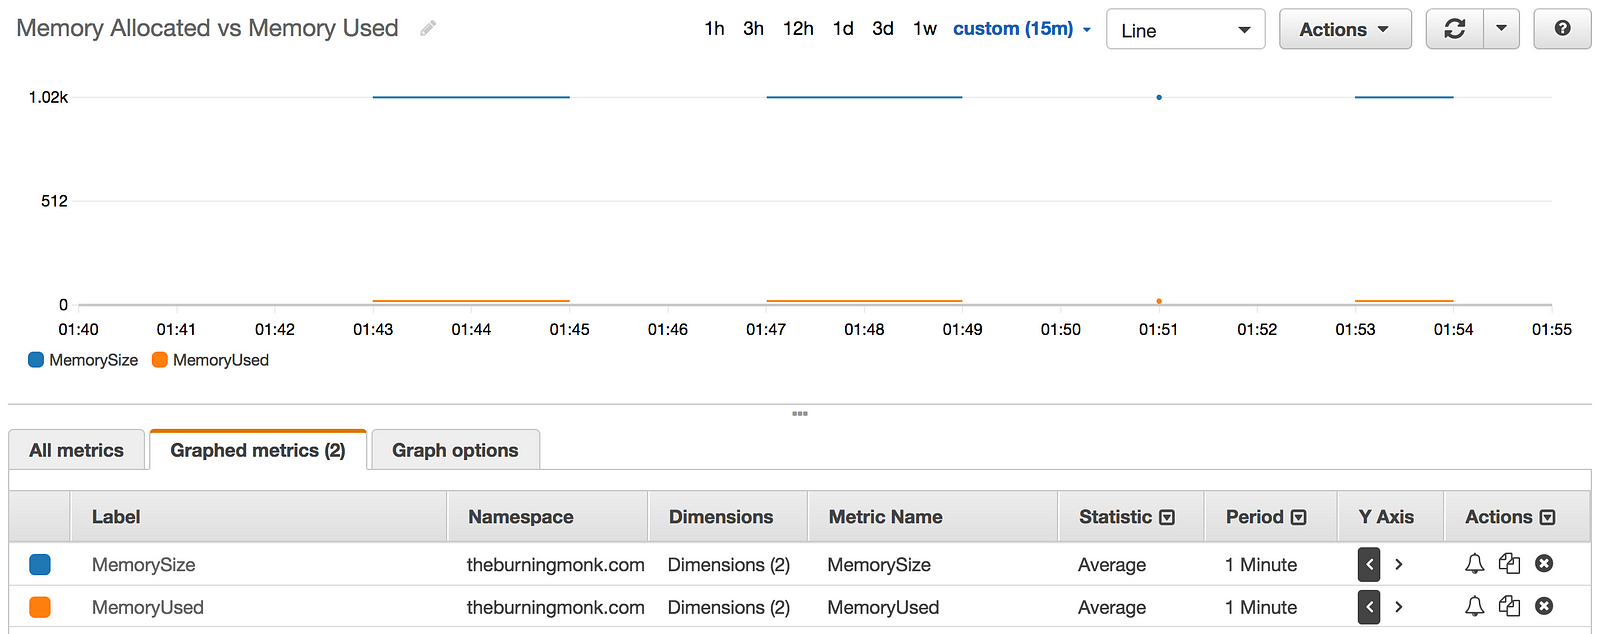
And sure enough, after subscribing the log group for an API (created in the same demo project to test this) and invoking the API, I’m able to see these new metrics show up in CloudWatch metrics.
Looking at the graph, maybe I can reduce my cost by running it on a much smaller memory size.
Take a look at the usage-metrics function in this repo.
Mind the concurrency!
When processing CloudWatch Logs with Lambda functions, you need to be mindful of the no. of concurrent executions it creates so to not run foul of the concurrent execution limit.
Since this is an account-wide limit, it means your log-shipping function can cause cascade failures throughout your entire application. Critical functions can be throttled because too many executions are used to push logs out of CloudWatch Logs – not a good way to go down ;-)
What we need is a more fine-grained throttling mechanism for Lambda. It’s fine to have an account-wide limit, but we should be able to create pools of functions that can have slices of that limit. For example, tier-1 functions (those serving the core business needs) gets 90% of the available concurrent executions. Whilst tier-2 functions (BI, monitoring, etc.) gets the other 10%.
As things stand, we don’t have that, and the best you can do is to keep the execution of your log-shipping function brief. Maybe that means fire-and-forget when sending logs and metrics; or send the decoded log messages into a Kinesis stream where you have more control over parallelism.
Or, maybe you’ll monitor the execution count of these tier-2 functions and when the no. of executions/minute breaches some threshold you’ll temporarily unsubscribe log groups from the log-shipping function to alleviate the problem.
Or, maybe you’ll install some bulkheads by moving these tier-2 functions into a separate AWS account and use cross-account invocation to trigger them. But this seems a really heavy-handed way to workaround the problem!
Point is, it’s not a solved problem and I haven’t come across a satisfying workaround yet. AWS is aware of this gap and hopefully they’ll add support for better control over concurrent executions.
Whenever you’re ready, here are 3 ways I can help you:
- Production-Ready Serverless: Join 20+ AWS Heroes & Community Builders and 1000+ other students in levelling up your serverless game. This is your one-stop shop to level up your serverless skills quickly.
- Do you want to know how to test serverless architectures with a fast dev & test loop? Check out my latest course, Testing Serverless Architectures and learn the smart way to test serverless.
- I help clients launch product ideas, improve their development processes and upskill their teams. If you’d like to work together, then let’s get in touch.