
Yan Cui
I help clients go faster for less using serverless technologies.
part 1: overview
part 2: testing and CI/CD
part 3: ops <- you’re here
part 4: building a scalable notification system
part 5: building a better recommendation system
A couple of folks asked me about our strategy for monitoring, logging, etc. after part 2, and having watched Chris Swan talk about “Serverless Operations is not a Solved Problem” at the Serverless meetup it’s a good time for us to talk about how we approached ops with AWS Lambda.
NoOps != No Ops
The notion of “NoOps” have often been mentioned with serverless technologies (I have done it myself), but it doesn’t mean that you no longer have to worry about ops.
To me, “ops” is the umbrella term for everything related to keeping my systems operational and performing within acceptable parameters, including (but not limited to) resource provisioning, configuration management, monitoring and being on-hand to deal with any live issues. The responsibilities of keeping the systems up and running will always exist regardless whether your software is running on VMs in the cloud, on-premise hardware, or as small Lambda functions.
Within your organization, someone needs to fulfill these responsibilities. It might be that you have a dedicated ops team, or perhaps your developers will share those responsibilities.
NoOps to me, means no ops specialization in my organization – ie. no dedicated ops team – because the skills and efforts required to fulfill the ops responsibilities do not justify the need for such specialization. As an organization it’s in your best interest to delay such specialization for as long as you can both from a financial point of view and also, perhaps more importantly, because Conway’s law tells us that having an ops team is the surefire way to end up with a set of operational procedures/processes, tools and infrastructure whose complexity will in turn justify the existence of said ops team.
At Yubl, as we migrated to a serverless architecture our deployment pipeline became more streamlined, our toolchain became simpler and we found less need for a dedicated ops team and were in the process of disbanding our ops team altogether.
Logging
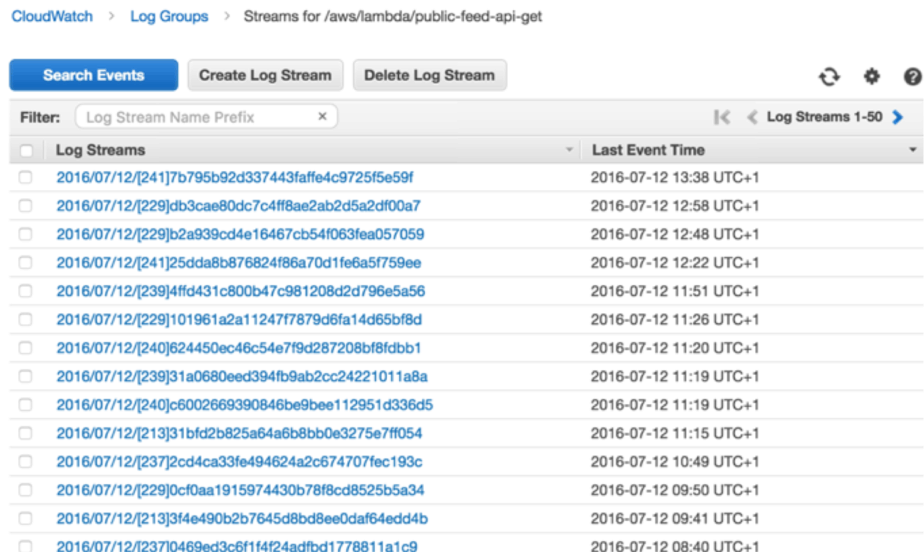
Whenever you write to the stdout from your Lambda function – eg. when you do console.log in your nodejs code – it ends up in the function’s Log Group in CloudWatch Logs.
Centralised Logging
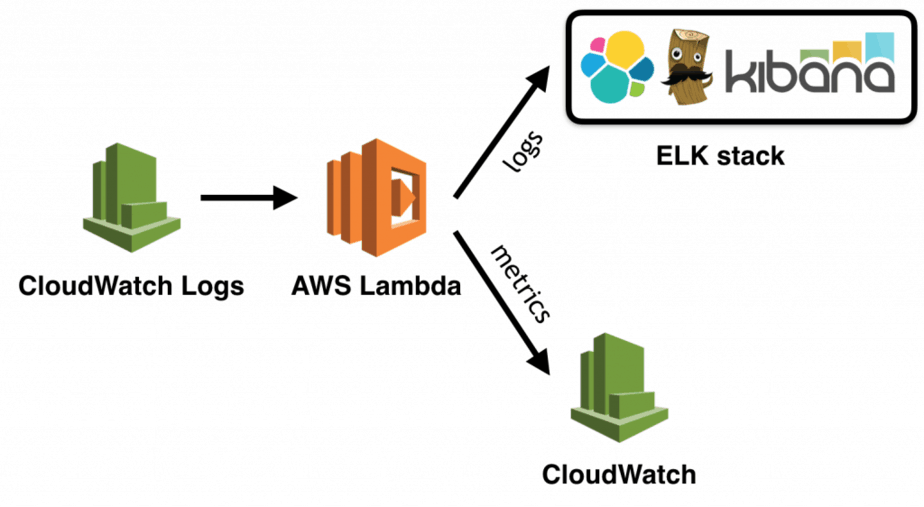
However, logs are not easily searchable, and once you have a dozen Lambda functions you will want to collect them in one central place. The ELK stack is the de facto standard for centralised logging these days, you can run your own ELK stack on EC2, and elastic.co also offers a hosted version of Elasticsearch and Kibana.

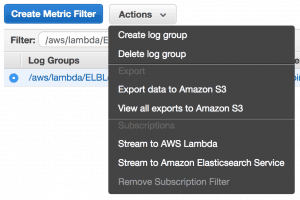
To ship your logs from CloudWatch Logs to ELK you can subscribe the Log Group to a cloudwatch-logs-to-elk function that is responsible for shipping the logs.
You can subscribe the Log Group manually via the AWS management console.
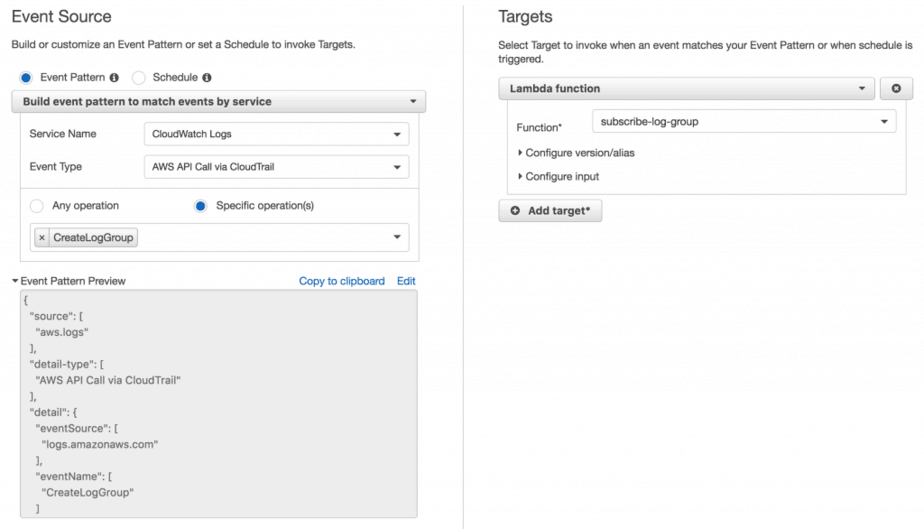
But, you don’t want a manual step everyone needs to remember every time they create a new Lambda function. Instead, it’s better to setup a rule in CloudWatch Events to invoke a subscribe-log-group Lambda function to set up the subscription for new Log Groups.
2 things to keep in mind:
- lots services create logs in CloudWatch Logs, so you’d want to filter Log Groups by name, Lambda function logs have the prefix /aws/lambda/
- don’t subscribe the Log Group for the cloudwatch-logs-to-elk function (or whatever you decide to call it), otherwise you create an infinite loop for the cloudwatch-logs-to-elk function where its own logs will trigger itself and produce more logs and so on
Distributed Tracing
Having all your logs in one easily searchable place is great, but as your architecture expands into more and more services that depends on one another you will need to correlated logs from different services to understand all the events that occurred during one user request.
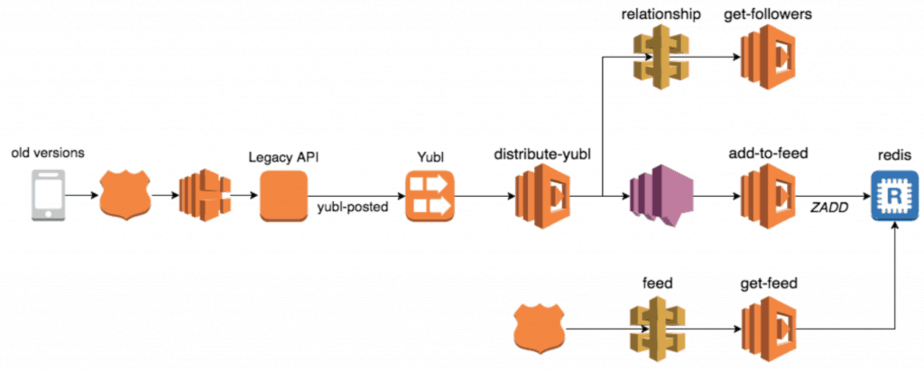
For instance, when a user creates a new post in the Yubl app we distribute the post to all of the user’s followers. Many things happen along this flow:
- user A’s client calls the legacy API to create the new post
- the legacy API fires a yubl-posted event into a Kinesis stream
- the distribute-yubl function is invoked to handle this event
- distribute-yubl function calls the relationship-api to find user A’s followers
- distribute-yubl function then performs some business logic, group user A’s followers into batches and for each batch fires a message to a SNS topic
- the add-to-feed function is invoked for each SNS message and adds the new post to each follower’s feed
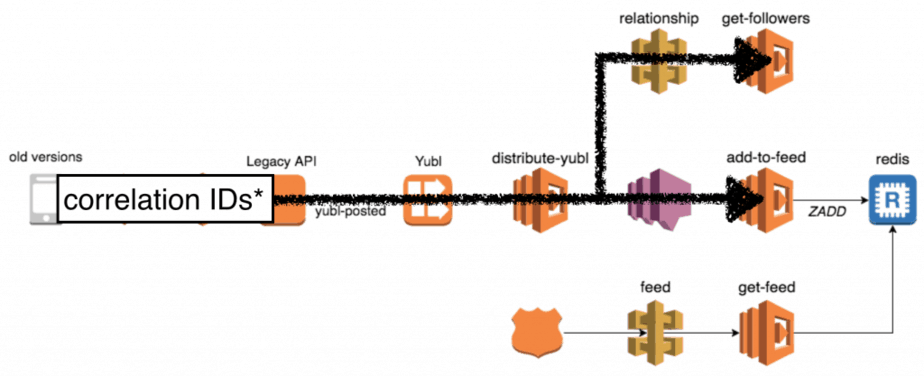
If one of user A’s followers didn’t receive his new post in the feed then the problem can lie in a number of different places. To make such investigations easier we need to be able to see all the relevant logs in chronological order, and that’s where correlation IDs (eg. initial request-id, user-id, yubl-id, etc.) come in.
Because the handling of the initial user request flows through API calls, Kinesis events and SNS messages, it means the correlation IDs also need to be captured and passed through API calls, Kinesis events and SNS messages.
Our approach was to roll our own client libraries which will pass the captured correlation IDs along.
Capturing Correlation IDs
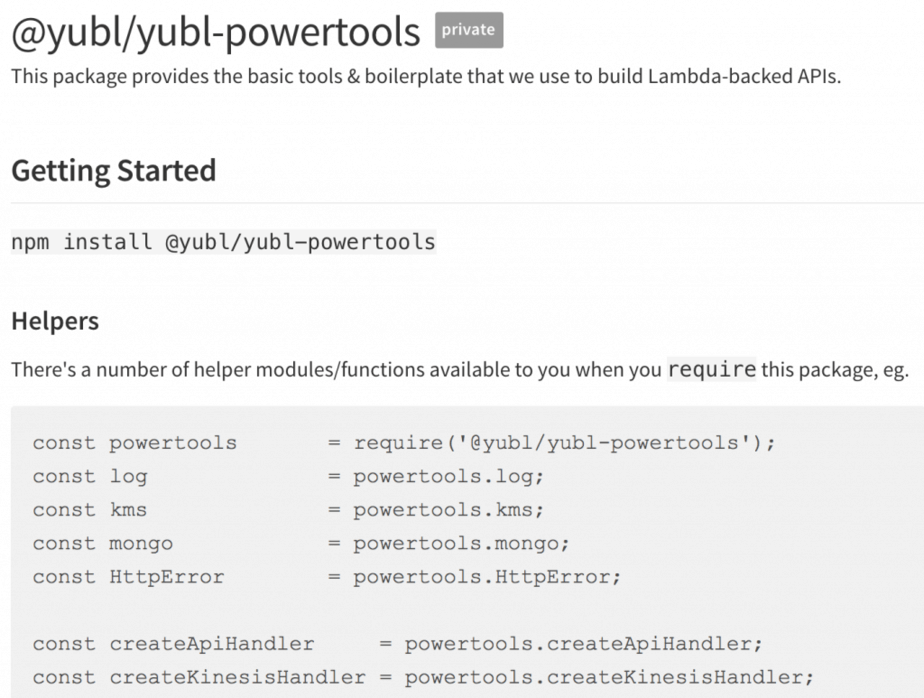
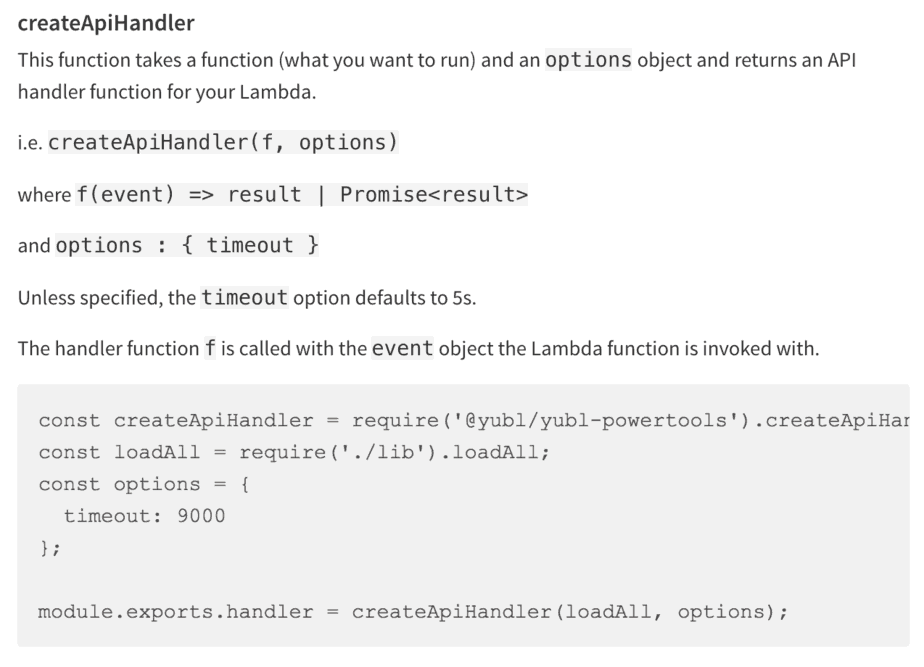
All of our Lambda functions are created with wrappers that wraps your handler code with additional goodness such as capturing the correlation IDs into a global.CONTEXT object (which works because nodejs is single-threaded).
Forwarding Correlation IDs
Our HTTP client library is a thin wrapper around the superagent HTTP client and injects the captured correlation IDs into outgoing HTTP headers.
We also have a client library for publishing Kinesis events, which can inject the correlation IDs into the record payload.
For SNS, you can include the correlation IDs as message attributes when publishing a message.
Zipkin and Amazon X-Ray
Since then, AWS has announced x-ray but it’s still in preview so I have not had a chance to see how it works in practice, and it doesn’t support Lambda at the time of writing.
There is also Zipkin, but it requires you to run additional infrastructure on EC2 and whilst it has wide range of support for instrumentation the path to adoption in the serverless environment (where you don’t have or need traditional web frameworks) is not clear to me.
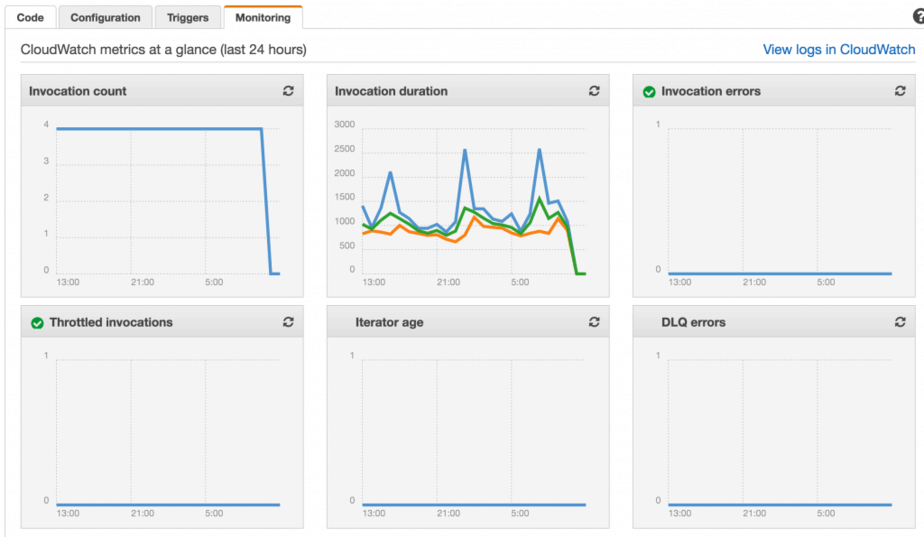
Monitoring
Out of the box you get a number of basic metrics from CloudWatch – invocation counts, durations, errors, etc.
You can also publish custom metrics to CloudWatch (eg. user created, post viewed) using the AWS SDK. However, since these are HTTP calls you have to be conscious of the latencies they’ll add for user-facing functions (ie. those serving APIs). You can mitigate the added latencies by publishing them in a fire-and-forget fashion, and/or budgeting the amount of time (say, to a max of 50ms) you can spend publishing metrics at the end of a request.
Because you have to do everything during the invocation of a function, it forces you to make trade offs.
Another approach is to take a leaf from Datadog’s book and use special log messages and process them after the fact. For instance, if you write logs in the format MONITORING|epoch_timestamp|metric_value|metric_type|metric_name like below..
console.log(“MONITORING|1489795335|27.4|latency|user-api-latency”);
console.log(“MONITORING|1489795335|8|count|yubls-served”);
then you can process these log messages (see Logging section above) and publish them as metrics instead. With this approach you’ll be trading off liveness of metrics for less API latency overhead.
Of course, you can employ both approaches in your architecture and use the appropriate one for each situation:
- for functions on the critical path (that will directly impact the latency your users experience), choose the approach of publishing metrics as special log messages;
- for other functions (cron jobs, kinesis processors, etc.) where invocation duration doesn’t significantly impact a user’s experience, publish metrics as part of the invocation
Dashboards + Alerts
We have a number of dashboards setup in CloudWatch as well as Graphite (using hostedgraphite, for our legacy stack running on EC2), and they’re displayed on large monitors near the server team area. We also set up alerts against various metrics such as API latencies and error count, and have opsgenie setup to alert whoever’s on-call that week.
Consider alternatives to CloudWatch
Whilst CloudWatch is good, cost-effective solution for monitoring (in some cases the only way to get metrics out of AWS services such as Kinesis and DynamoDB) it has its drawbacks.
Its UI and customization is not on-par with competitors such as Graphite, Datadog and Sysdig, and it lacks advanced features such as anomaly detection and finding correlations that you find in Stackdrvier and Wavefront.
The biggest limitation however, is that CloudWatch metrics are only granular to the minute. It means your time to discovery of issues is measured in mins (you need a few data points to separate real issues that require manual intervention from temporary blips) and consequently your time to recover is likely to be measured in tens of mins. As your scale up and the cost of unavailability goes up you need to invest efforts to cut down both times, which might mean that you need more granular metrics than CloudWatch is able to give you.
Another good reason for not using CloudWatch is that, you really don’t want your monitoring system to fail at the same time as the system it monitors. Over the years we have experienced a number of AWS outages that impacted both our core systems running on EC2 as well as CloudWatch itself. As our system fails and recovers we don’t have the visibility to see what’s happening and how it’s impacting our users.
Config Management
Whatever approach you use for config management you should always ensure that:
- sensitive data (eg. credentials, connection strings) are encrypted in-flight, and at rest
- access to sensitive data should be based on roles
- you can easily and quickly propagate config changes
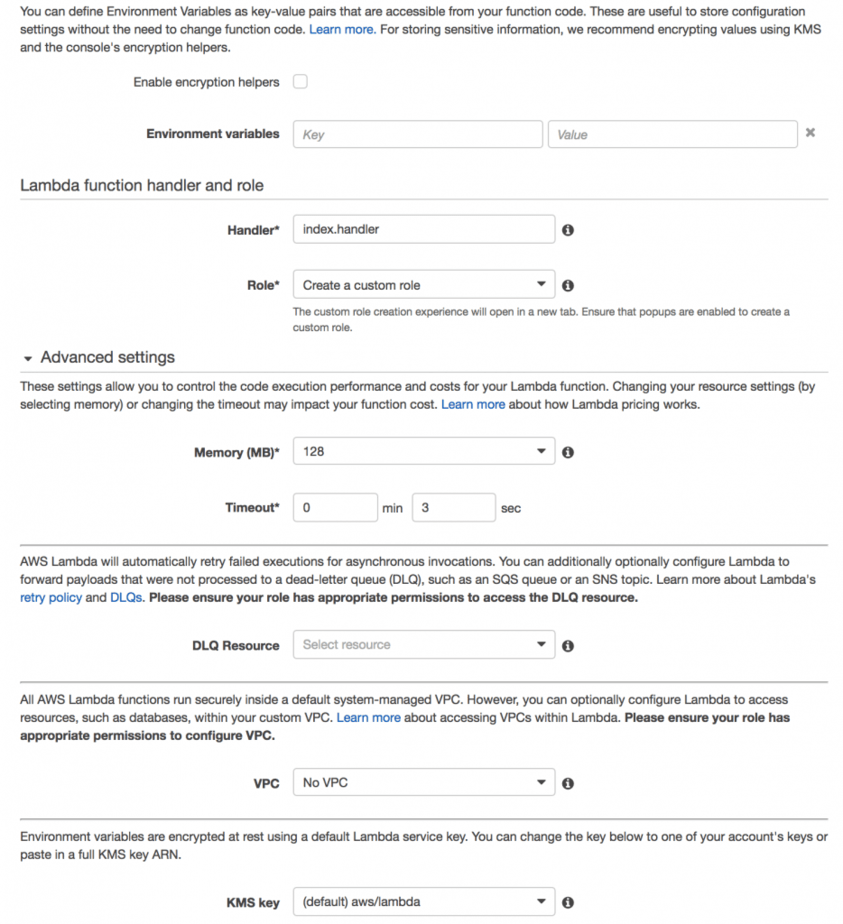
Nowadays, you can add environment variables to your Lambda functions directly, and have them encrypted with KMS.
This was the approach we started with, albeit using environment variables in the Serverless framework since it wasn’t a feature of the Lambda service at the time. After we had a dozen functions that share config values (eg. MongoDB connection strings) this approach became cumbersome and it was laborious and painfully slow to propagate config changes manually (by updating and re-deploying every function that require the updated config value).
It was at this point in our evolution that we moved to a centralised config service. Having considered consul (which I know a lot of folks use) we decided to write our own using API Gateway, Lambda and DynamoDB because:
- we don’t need many of consul‘s features, only the kv store
- consul is another thing we’d have to run and manage
- consul is another thing we’d have to learn
- even running consul with 2 nodes (you need some redundancy for production) it is still order of magnitude more expensive
Sensitive data are encrypted (by a developer) using KMS and stored in the config API in its encrypted form, when a Lambda function starts up it’ll ask the config API for the config values it needs and it’ll use KMS to decrypt the encrypted blob.
We secured access to the config API with api keys created in API Gateway, in the event these keys are compromised attackers will be able to update config values via this API. You can take this a step further (which we didn’t get around to in the end) by securing the POST endpoint with IAM roles, which will require developers to make signed requests to update config values.
Attackers can still retrieve sensitive data in encrypted form, but they will not be able to decrypt them as KMS also requires role-based access.
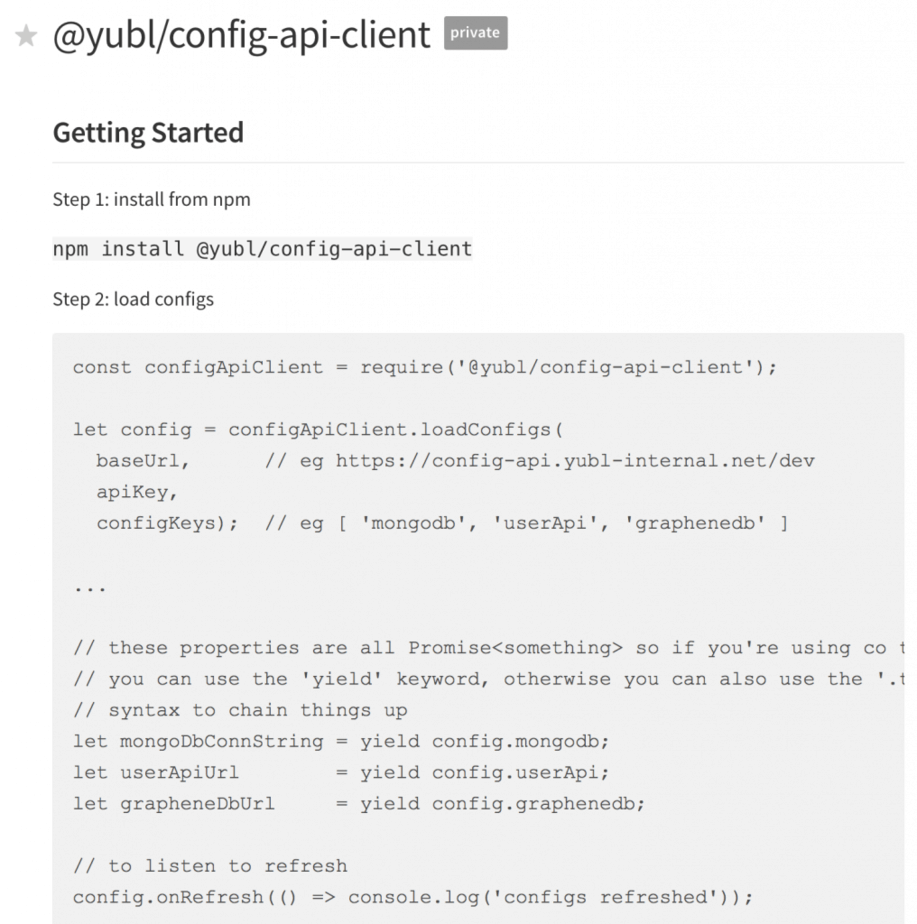
client library
As most of our Lambda functions need to talk to the config API we invested efforts into making our client library really robust and baked in caching support and periodic polling to refresh config values from the source.
So, that’s it folks, hope you’ve enjoyed this post.
The emergence of AWS Lambda and other serverless technologies have significantly simplified the skills and tools required to fulfil the ops responsibilities inside an organization. However, this new paradigm has also introduced new limitations and challenges for existing toolchains and requires us to come up with new answers. Things are changing at an incredibly fast pace, and I for one am excited to see what new practices and tools emerge from this space!
Whenever you’re ready, here are 3 ways I can help you:
- Production-Ready Serverless: Join 20+ AWS Heroes & Community Builders and 1000+ other students in levelling up your serverless game. This is your one-stop shop to level up your serverless skills quickly.
- Do you want to know how to test serverless architectures with a fast dev & test loop? Check out my latest course, Testing Serverless Architectures and learn the smart way to test serverless.
- I help clients launch product ideas, improve their development processes and upskill their teams. If you’d like to work together, then let’s get in touch.
Pingback: AWS X-Ray and Lambda : the good, the bad and the ugly | theburningmonk.com
Have you looked AWS EC2 Parameter Store for central management of your environment variables?
Funny you should mention that! https://hackernoon.com/you-should-use-ssm-parameter-store-over-lambda-env-variables-5197fc6ea45b