
Yan Cui
I help clients go faster for less using serverless technologies.
Many clients have asked me “how do I record custom metrics from Lambda?”.
Generally speaking, you can either:
- Publish custom metrics synchronously – e.g. send them at the end of an invocation.
- Publish custom metrics asynchronously by writing them to stdout first and then extracting them from CloudWatch Logs.
Problems with sending custom metrics synchronously
The synchronous approach adds latency to invocations. This can be especially problematic when those extra milliseconds are experienced by our users. For example, if the user is waiting for an API response.
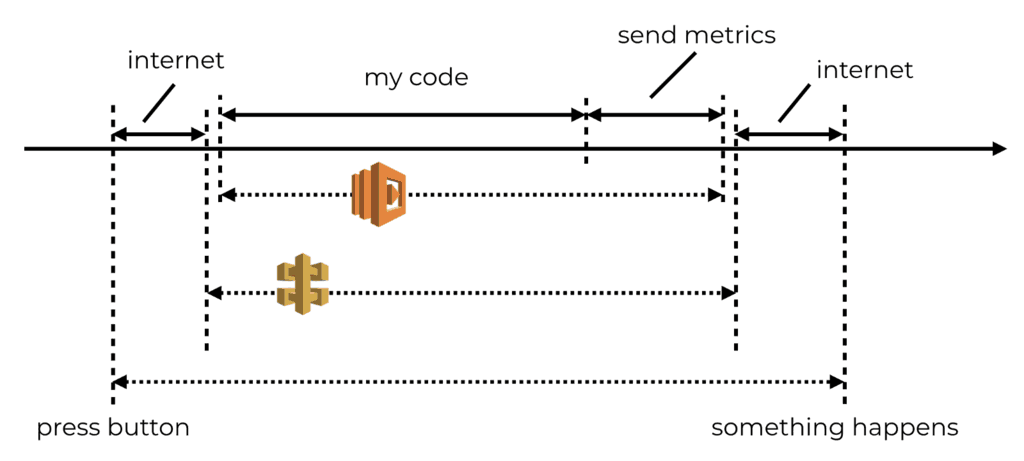
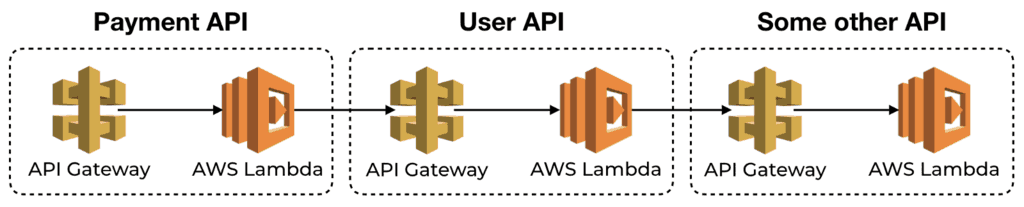
Individually, the delay might be negligible. CloudWatch metrics typically respond within tens of milliseconds. That is acceptable to most. But they can quickly compound when functions call one another via API Gateway.
Moreover, services are most fragile around their integration points – i.e. when they make network calls to other services. Publishing metrics to CloudWatch introduces another integration point that you need to harden.
If CloudWatch experiences an outage, surely you would still want your system to stay up, right? Similarly, if CloudWatch experiences elevated response time then you wouldn’t want your functions to timeout as a result!
Hence why I generally prefer to record custom metrics asynchronously, even though this approach also has its drawbacks:
- There is an additional delay in seeing the most recent metric data.
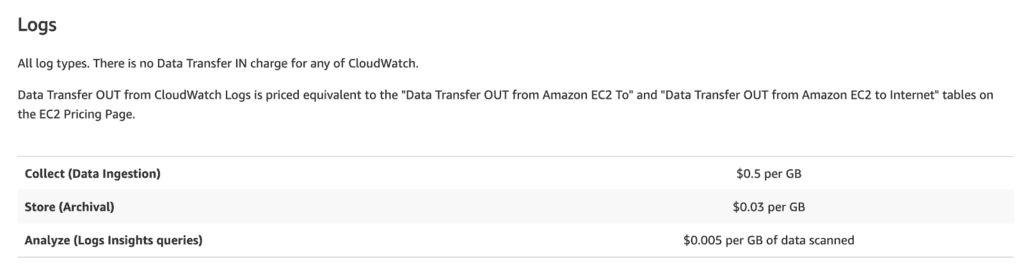
- It’s sending more data to CloudWatch Logs, which has a cost implication
- It introduces complexity because you need something to process the logs and turn them into metrics.
Sending custom metrics asynchronously
In simple cases, where you have few custom metrics, CloudWatch metric filters are the way to go. However, this approach does not scale with complexity – when you have lots of functions and custom metrics.
Instead, you can use a Lambda function.
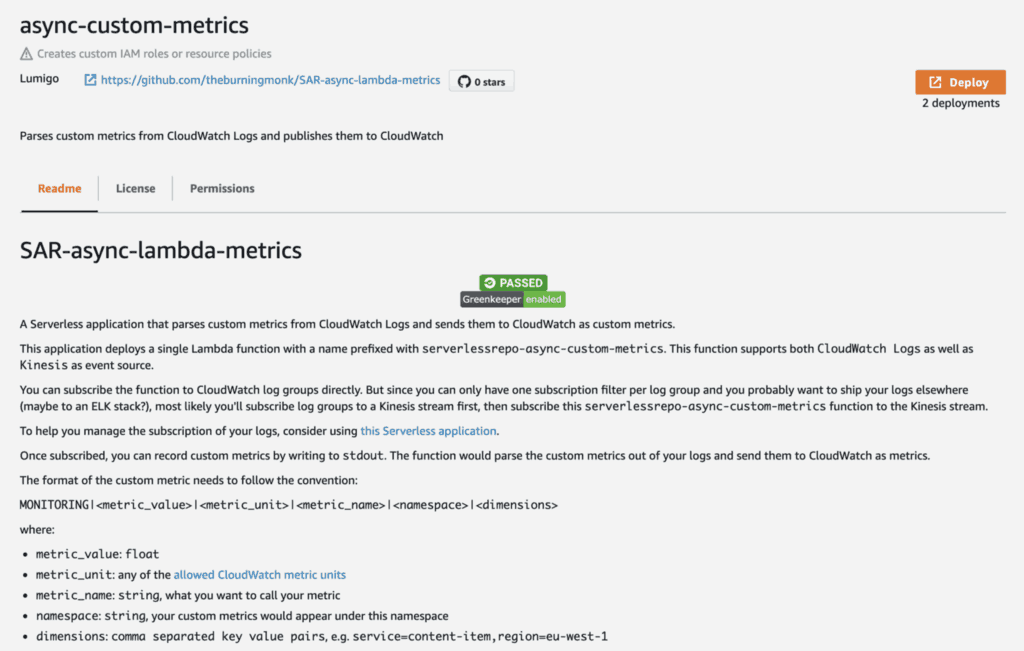
To make it really easy for you to record custom metrics asynchronously, I have published a new application to the Serverless Application Repository. You can also check out the source code on GitHub here.
Getting started
You can deploy the app via the AWS console here, by clicking the Deploy button and follow the instructions.
Or you can deploy it as part of a CloudFormation stack with AWS SAM:
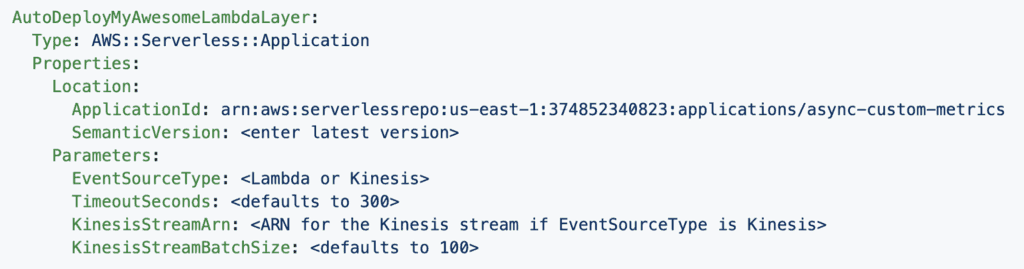
You can do the same via CloudFormation or the Serverless framework. You need to first add the following Transform though. For more details on how to do this with the Serverless framework, read this post.
Transform: AWS::Serverless-2016-10-31
We announced this new app live on Twitch yesterday. You can go to the 21:00 mark and see how you can configure everything via CloudFormation, including subscribing all CloudWatch log groups to a Kinesis stream first, before subscribing this app to that stream.
Recording custom metrics
Once deployed, you would be able to record custom metrics by writing to stdout in this format:
MONITORING|<value>|<unit>|<metric_name>|<namespace>|<dimensions>
where:
valueis afloatunitcan be any of the allowed CloudWatch metric unitsnamespace: custom metrics would appear under this namespace, e.g.
dimensions: comma-separated key-value pairs, e.g.service=content-item,region=eu-west-1
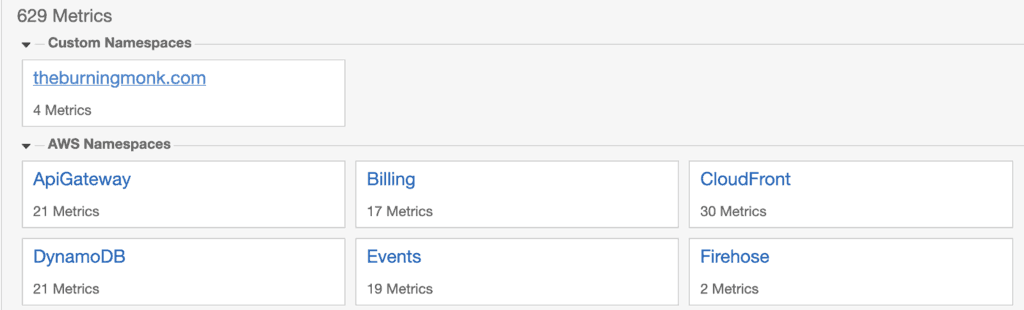
These messages would be processed and published as custom metrics in CloudWatch metrics. All without adding latency to your invocations!
Future works
I hope you enjoy this new app, and please feel free to suggest improvements via GitHub issues. Here are some ideas I have for making it more useful:
- Parse the
REPORTmessages at the end of an invocation and turnBilled Duration,Memory SizeandMemory Usedinto metrics:
![]()
- Since AppSync doesn’t report resolver metrics to CloudWatch, we can parse the resolver logs and report resolver duration as metrics.
Whenever you’re ready, here are 3 ways I can help you:
- Production-Ready Serverless: Join 20+ AWS Heroes & Community Builders and 1000+ other students in levelling up your serverless game. This is your one-stop shop for quickly levelling up your serverless skills.
- I help clients launch product ideas, improve their development processes and upskill their teams. If you’d like to work together, then let’s get in touch.
- Join my community on Discord, ask questions, and join the discussion on all things AWS and Serverless.