Yan Cui
I help clients go faster for less using serverless technologies.
This is something I’ve mentioned in my recent AOP talks, and I think it’s worthy of a wider audience as it can be very useful to anyone who’s obsessed with performance as I am.
At iwi, we take performance very seriously and are always looking to improve the performance of our applications. In order for us to identify the problem areas and focus our efforts on the big wins we first need a way to measure and monitor the individual performance of the different components inside our system, sometimes down to a method level.
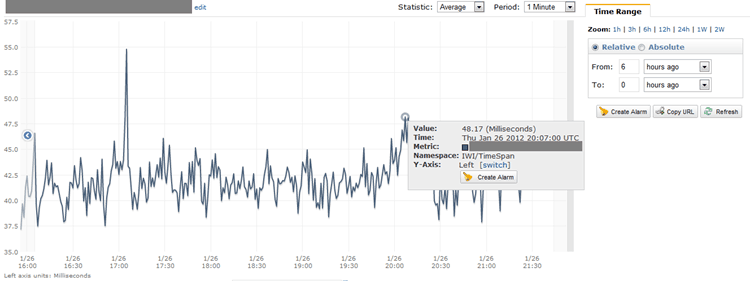
Fortunately, with the help of AOP and AWS CloudWatch we’re able to get a pseudo-realtime view on how frequently a method is executed and how much time it takes to execute, down to one minute intervals:

With this information, I can quickly identify methods that are the worst offenders and focus my profiling and optimization efforts around those particular methods/components.
Whilst I cannot disclose any implementation details in this post, it is my hope that it’ll be sufficient to give you an idea of how you might be able to implement a similar mechanism.
AOP
A while back I posted about a simple attribute for watching method executing time and logging warning messages when a method takes longer than some pre-defined threshold.
Now, it’s possible and indeed easy to modify this simple attribute to instead keep track of the execution times and bundle them up into average/min/max values for a given minute. You can then publish these minute-by-minute metrics to AWS CloudWatch from each virtual instance and let the CloudWatch service itself handle the task of aggregating all the data-points.
By encapsulating the logic of measuring execution time into an attribute, you can start measuring a particular method by simply applying the attribute to that method. Alternatively, PostSharp supports pointcut and lets you multicast an attribute to many methods at once, and allows you to filter the method target by name as well as visibility level. It is therefore possible for you to start measuring and publishing the execution time of ALL public methods in a class/assembly with only one line of code!
CloudWatch
The CloudWatch service should be familiar to anyone who has used AWS EC2 before, it’s a monitoring service primarily for AWS cloud resources (virtual instances, load balancers, etc.) but it also allows you to publish your own data about your application. Even if your application is not being hosted inside AWS EC2, you can still make use of the CloudWatch service as long as you have an AWS account and a valid AWS access key and secret.
Once published, you can visualize your data inside the AWS web console, depending on the type of data you’re publishing there are a number of different ways you can view them – Average, Min, Max, Sum, Count, etc.
Note that AWS only keeps up to two weeks worth of data, so if you want to keep the data for longer you’ll have to query and store the data yourself. For instance, it makes sense to keep a history of hourly averages for the method execution times you’re tracking so that in the future, you can easily see where and when a particular change has impacted the performance of those methods. After all, storage is cheap and even with thousands of data points you’ll only be storing that many rows per hour.
Whenever you’re ready, here are 3 ways I can help you:
- Production-Ready Serverless: Join 20+ AWS Heroes & Community Builders and 1000+ other students in levelling up your serverless game. This is your one-stop shop for quickly levelling up your serverless skills.
- I help clients launch product ideas, improve their development processes and upskill their teams. If you’d like to work together, then let’s get in touch.
- Join my community on Discord, ask questions, and join the discussion on all things AWS and Serverless.

it’s great !!!, any sample code about it ? regards
@kiquenet – I can’t disclose the code we’re using as it’s proprietary to the company, but the general concept is there and you should be able to put a similar implementation together yourself.
Pingback: Tips and tricks for logging and monitoring AWS Lambda functions | NETWORKFIGHTS.COM
Pingback: Tips and tricks for logging and monitoring AWS Lambda functions | theburningmonk.com