
Yan Cui
I help clients go faster for less using serverless technologies.

TL;DR – AWS announced the long awaited auto scaling capability for DynamoDB, but we found it takes too long to scale up and doesn’t scale up aggressively enough as it’s held back by using consumed capacity as scaling metric rather than actual request count.
Here at Space Ape Games we developed an in-house tech to auto scale DynamoDB throughput and have used it successfully in production for a few years. It’s even integrated with our LiveOps tooling and scales up our DynamoDB tables according to the schedule of live events. This way, our tables are always provisioned just ahead of that inevitable spike in traffic at the start of an event.
Auto scaling DynamoDB is a common problem for AWS customers, I have personally implemented similar tech to deal with this problem at two previous companies. Whilst at Yubl, I even applied the same technique to auto scale Kinesis streams too.
When AWS announced DynamoDB Auto Scaling we were excited. However, the blog post that accompanied the announcement illustrated two problems:
- the reaction time to scaling up is slow (10–15 mins)
- it did not scale sufficiently to maintain the 70% utilization level
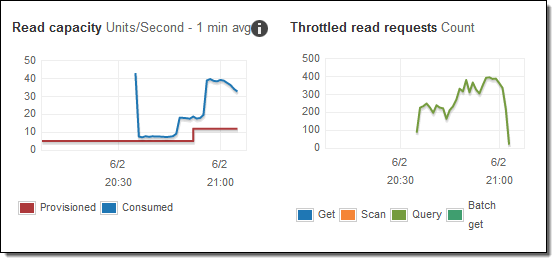
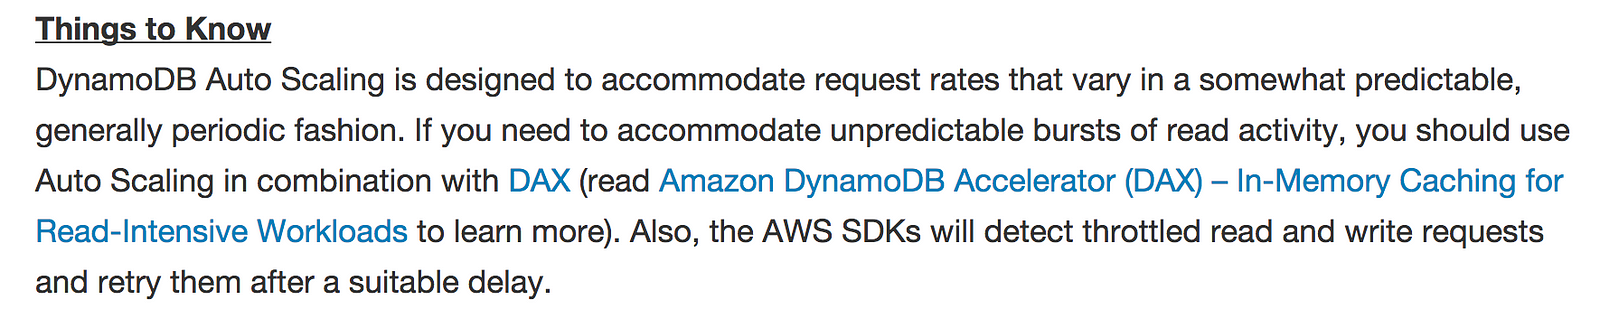
It looks as though the author’s test did not match the kind of workload that DynamoDB Auto Scaling is designed to accommodate:
In our case, we also have a high write-to-read ratio (typically around 1:1) because every action the players perform in a game changes their state in some way. So unfortunately we can’t use DAX as a get-out-of-jail free card.
How DynamoDB auto scaling works
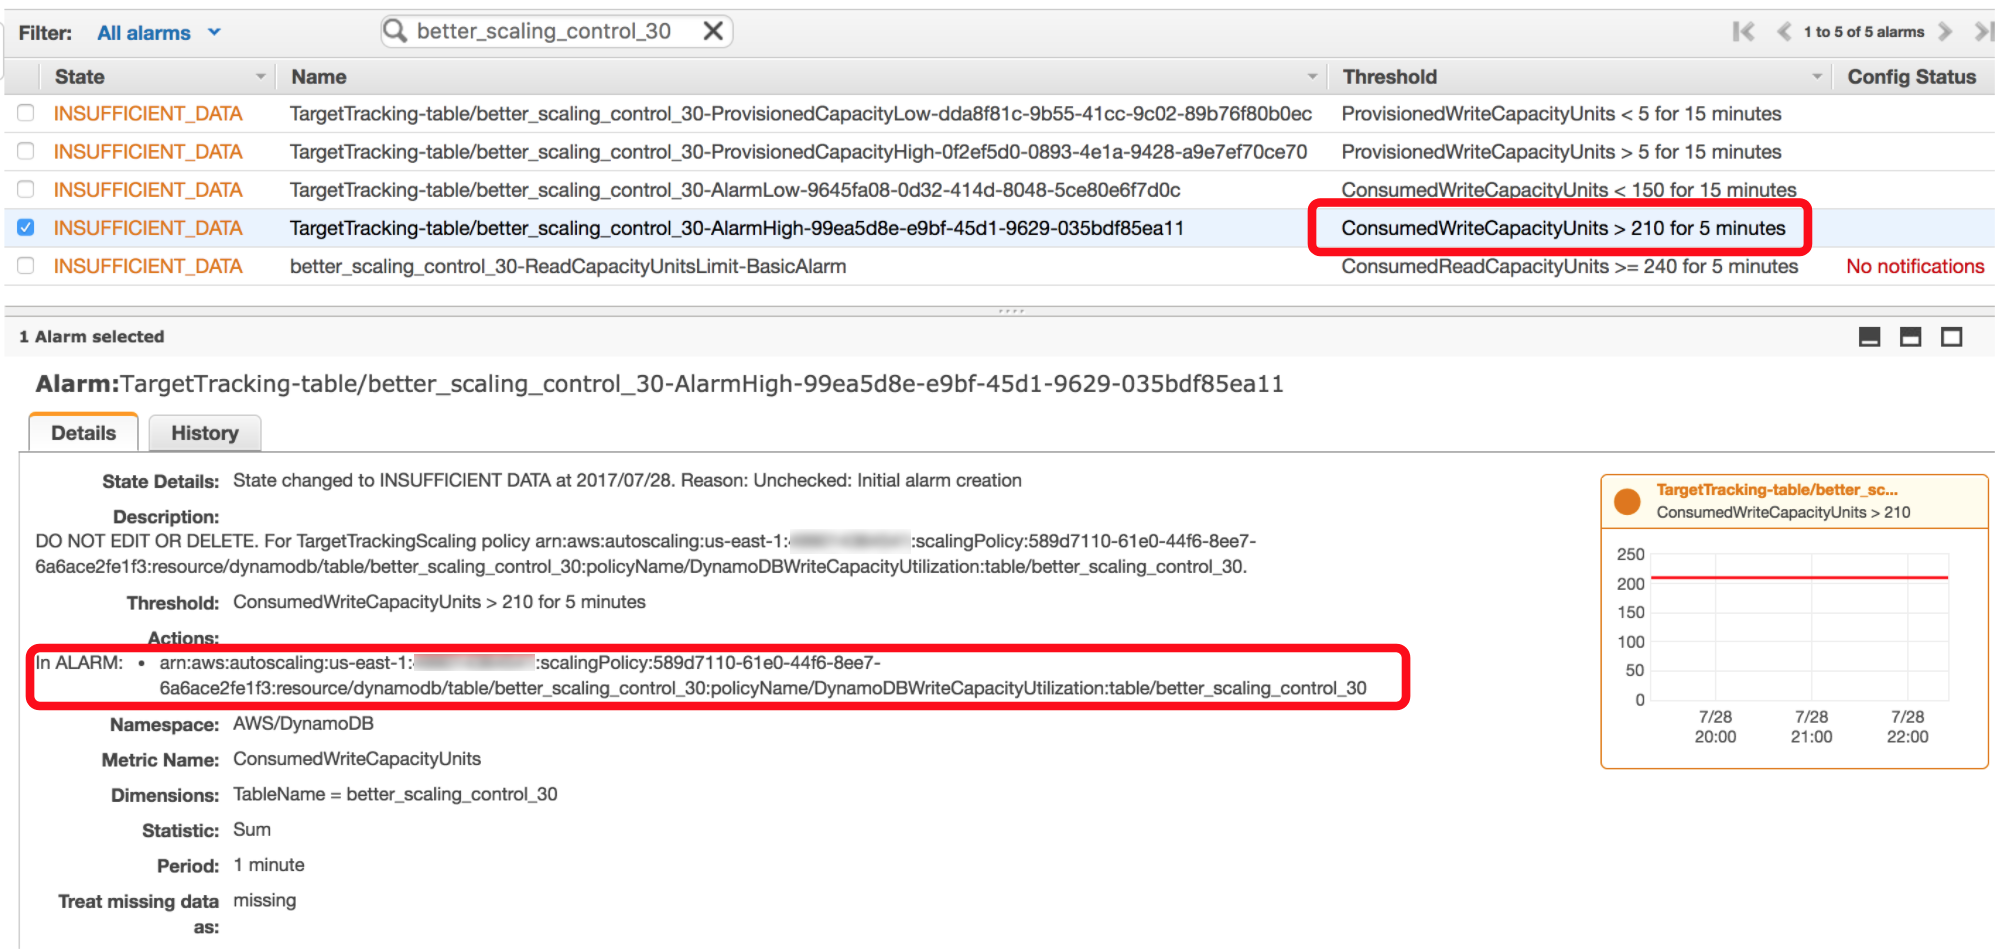
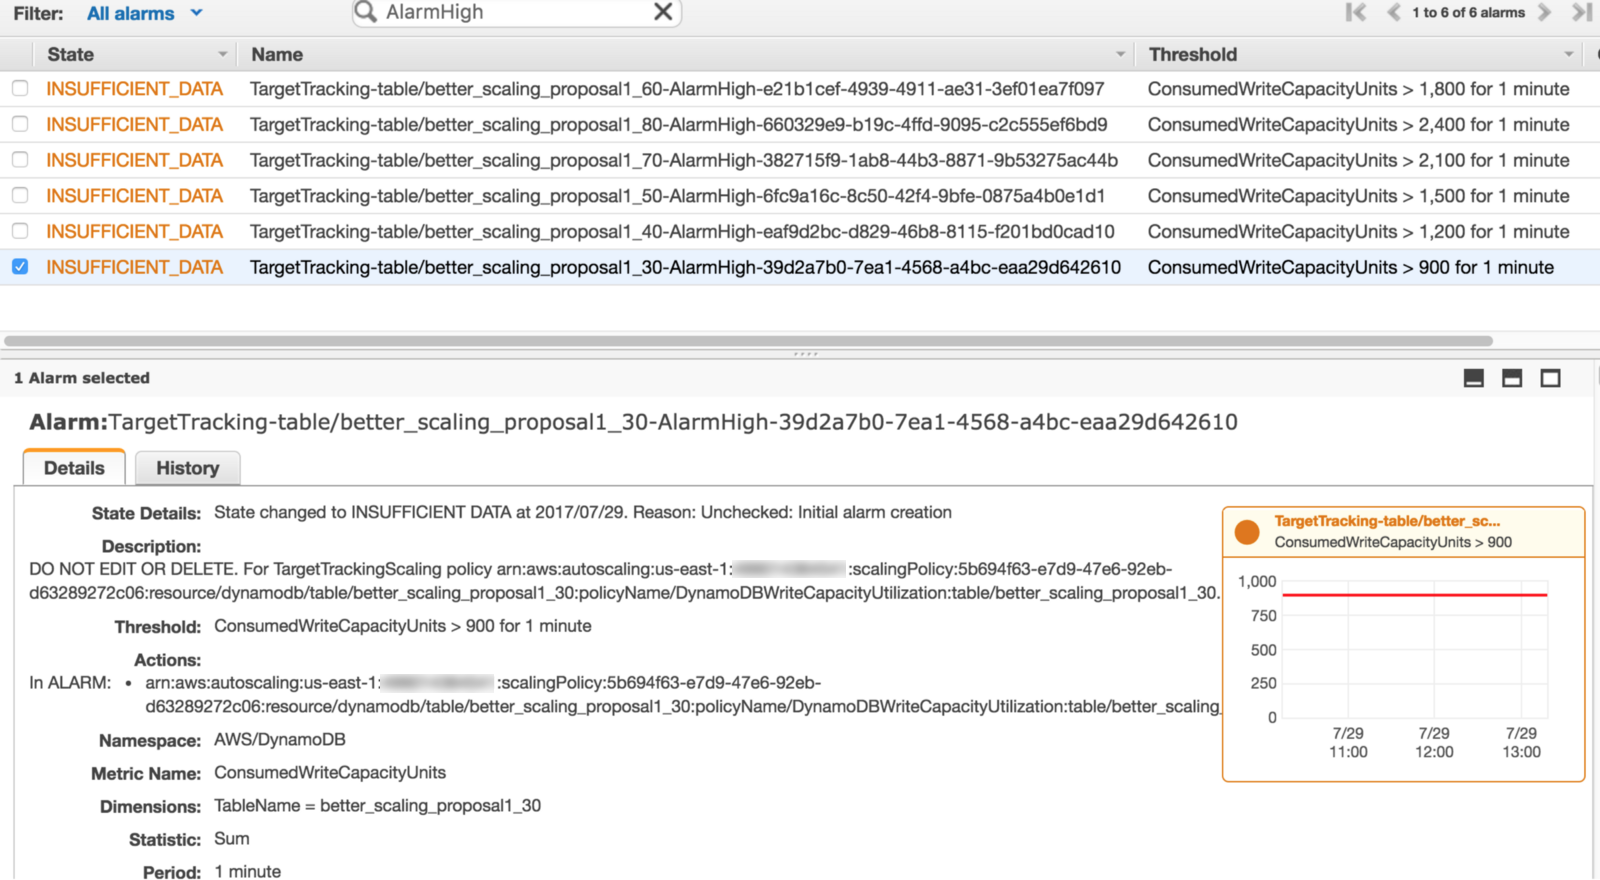
When you modify the auto scaling settings on a table’s read or write throughput, it automatically creates/updates CloudWatch alarms for that table – four for writes and four for reads.
As you can see from the screenshot below, DynamoDB auto scaling uses CloudWatch alarms to trigger scaling actions. When the consumed capacity units breaches the utilization level on the table (which defaults to 70%) for 5 mins consecutively it will then scale up the corresponding provisioned capacity units.
Problems with the current system, and how it might be improved
From our own tests we found DynamoDB’s lacklustre performance at scaling up is rooted in 2 problems:
- The CloudWatch alarms requires 5 consecutive threshold breaches. When you take into account the latency in CloudWatch metrics (which typically are a few mins behind) it means scaling actions occur up to 10 mins after the specified utilization level is first breached. This reaction time is too slow.
- The new provisioned capacity unit is calculated based on consumed capacity units rather than the actual request count. The consumed capacity units is itself constrained by the provisioned capacity units even though it’s possible to temporarily exceed the provisioned capacity units with burst capacity. What this means is that once you’ve exhausted the saved burst capacity, the actual request count can start to outpace the consumed capacity units and scaling up is not able to keep pace with the increase in actual request count. We will see the effect of this in the results from the control group later.
Based on these observations, we hypothesize that you can make two modifications to the system to improve its effectiveness:
- trigger scaling up after 1 threshold breach instead of 5, which is in-line with the mantra of “scale up early, scale down slowly”.
- trigger scaling activity based on actual request count instead of consumed capacity units, and calculate the new provisioned capacity units using actual request count as well.
As part of this experiment, we also prototyped these changes (by hijacking the CloudWatch alarms) to demonstrate their improvement.
Testing Methodology
The most important thing for this test is a reliable and reproducible way of generating the desired traffic patterns.
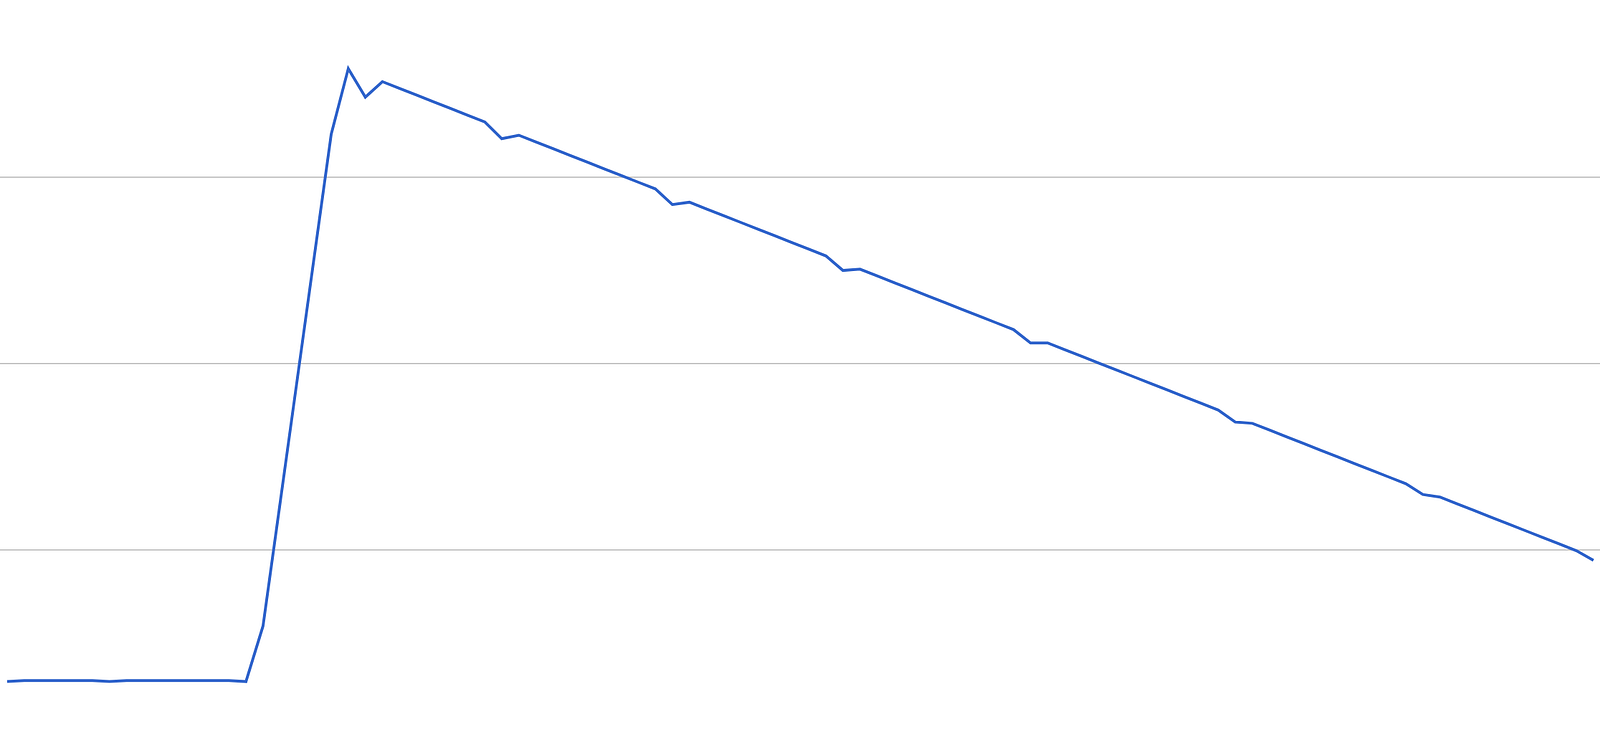
To do that, we have a recursive function that will make BatchPut requests against the DynamoDB table under test every second. The items per second rate is calculated based on the elapsed time (t) in seconds so it gives us a lot of flexibility to shape the traffic pattern we want.
Since a Lambda function can only run for a max of 5 mins, when context.getRemainingTimeInMillis() is less than 2000 the function will recurse and pass the last recorded elapsed time (t) in the payload for the next invocation.
The result is a continuous, smooth traffic pattern you see below.
We tested with 2 traffic patterns we see regularly.
Bell Curve
This should be a familiar traffic pattern for most – a slow & steady buildup of traffic from the trough to the peak, followed by a faster drop off as users go to sleep. After a period of steady traffic throughout the night things start to pick up again the next day.
For many of us whose user base is concentrated in the North America region, the peak is usually around 3–4am UK time – the more reason we need DynamoDB Auto Scaling to do its job and not wake us up!

Top Heavy
This sudden burst of traffic is usually precipitated by an event – a marketing campaign, a promotion by the app store, or in our case a scheduled LiveOpsevent.
In most cases these events are predictable and we scale up DynamoDB tables ahead of time via our automated tooling. However, in the unlikely event of an unplanned burst of traffic (and it has happened to us a few times) a goodauto scaling system should scale up quickly and aggressively to minimise the disruption to our players.
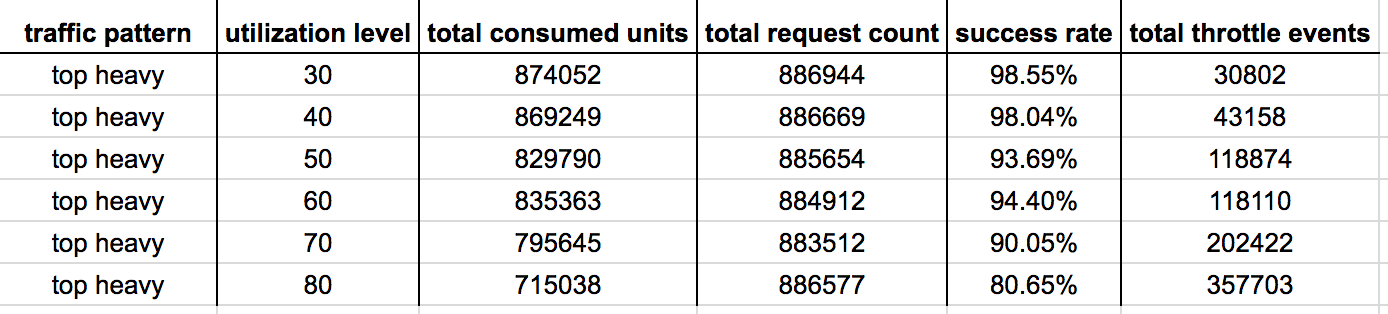
We tested these traffic patterns against several utilization level settings (default is 70%) to see how it handles them. We measured the performance of the system by:
- the % of successful requests (ie. consumed capacity / request count)
- the total no. of throttled requests during the test
These results will act as our control group.
We then tested the same traffic patterns against the 2 hypothetical auto scaling changes we proposed above.
To prototype the proposed changes we hijacked the CloudWatch alarms created by DynamoDB auto scaling using CloudWatch events.
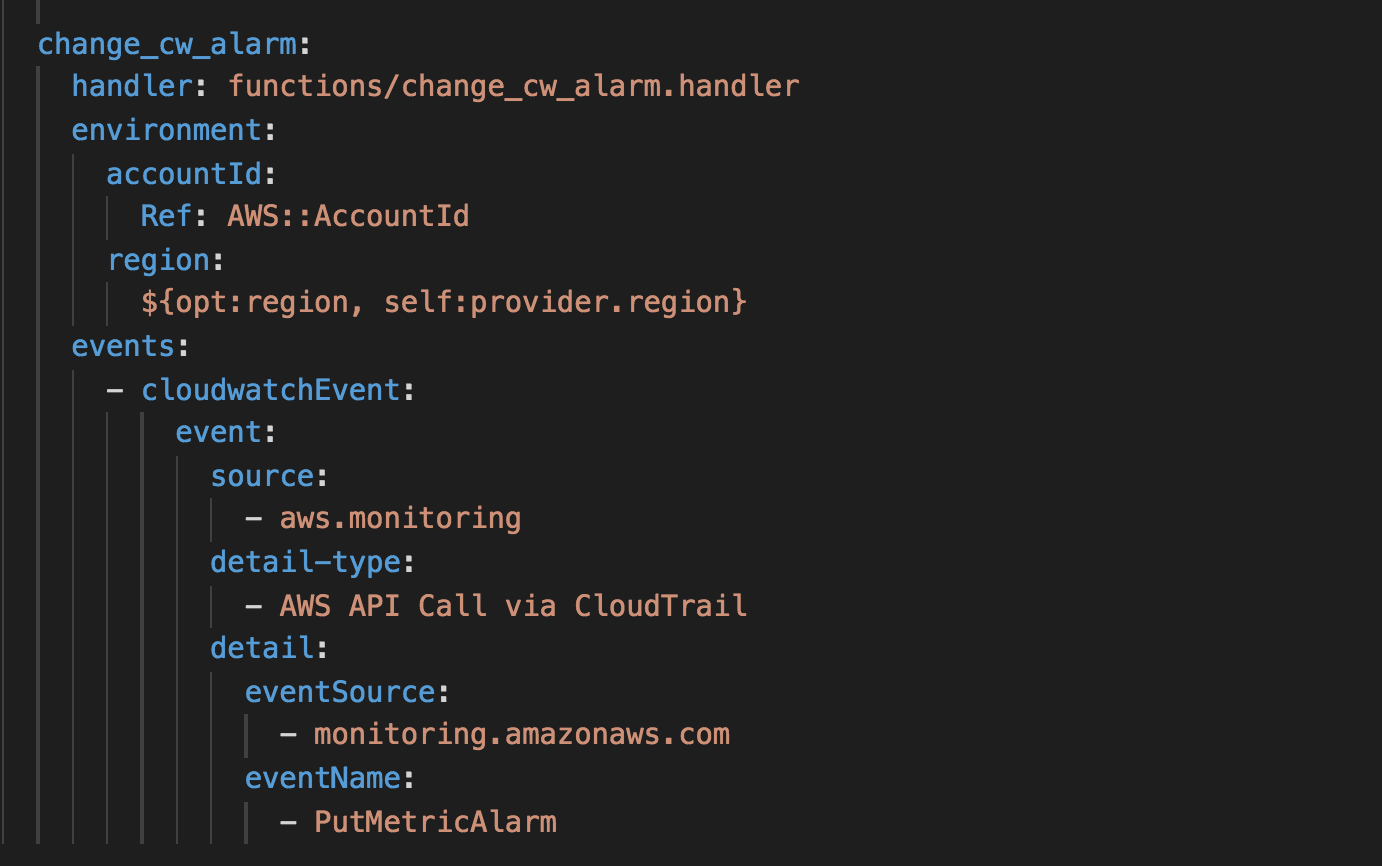
When a PutMetricAlarm API call is made, our change_cw_alarm function is invoked and replaces the existing CloudWatch alarms with the relevant changes – ie. set the EvaluationPeriods to 1 minute for hypothesis 1.
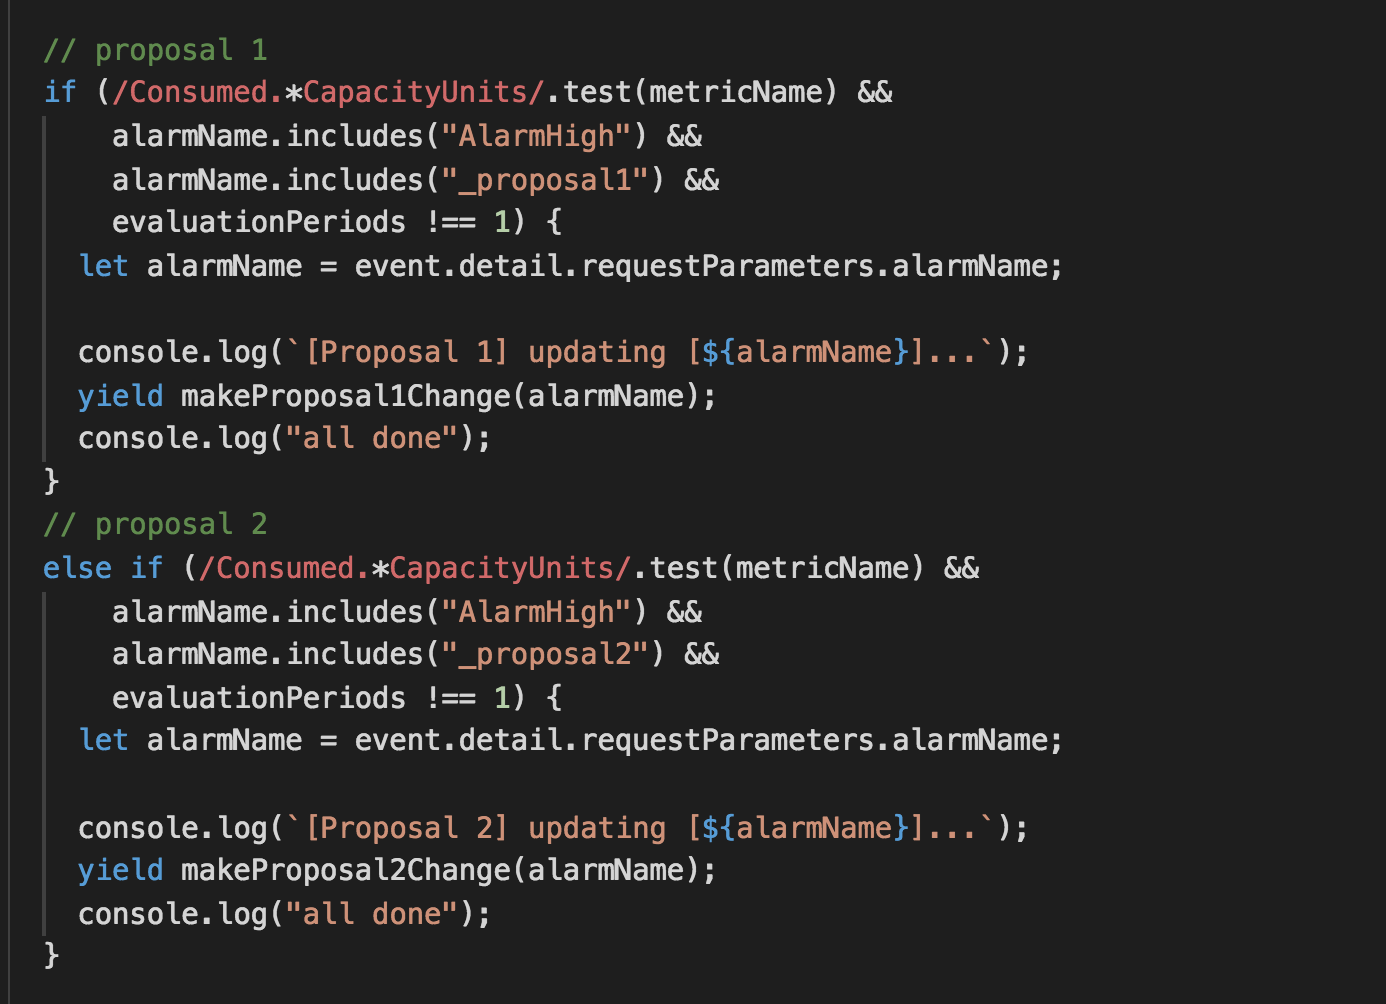
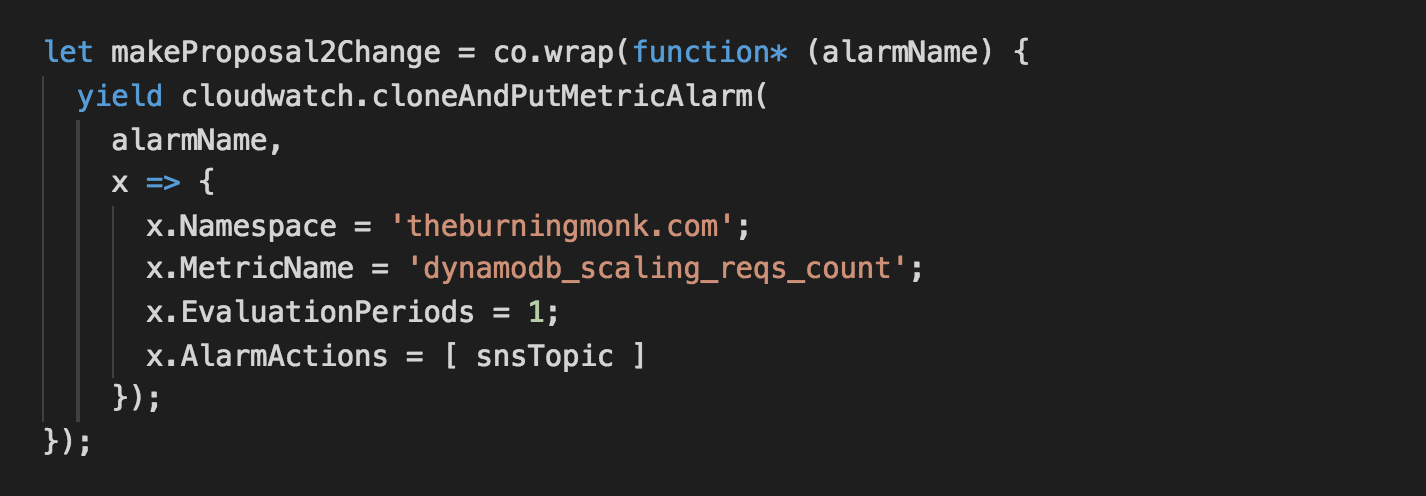
For hypothesis 2, we have to take over the responsibility of scaling up the table as we need to calculate the new provisioned capacity units using a custom metric that tracks the actual request count. Hence why the AlarmActions for the CloudWatch alarm is also overridden here.
Result (Bell Curve)
The test is setup as following:
- table starts off with 50 write capacity unit
- traffic holds steady for 15 mins at 25 writes/s
- traffic then increases to peak level (300 writes/s) at a steady rate over the next 45 mins
- traffic drops off back to 25 writes/s at a steady rate over the next 15 mins
- traffic holds steady at 25 writes/s
All the units in the diagrams are of SUM/min, which is how CloudWatch tracks ConsumedWriteCapacityUnits and WriteThrottleEvents, but I had to normalise the ProvisionedWriteCapacityUnits (which is tracked as per second unit) to make them consistent.
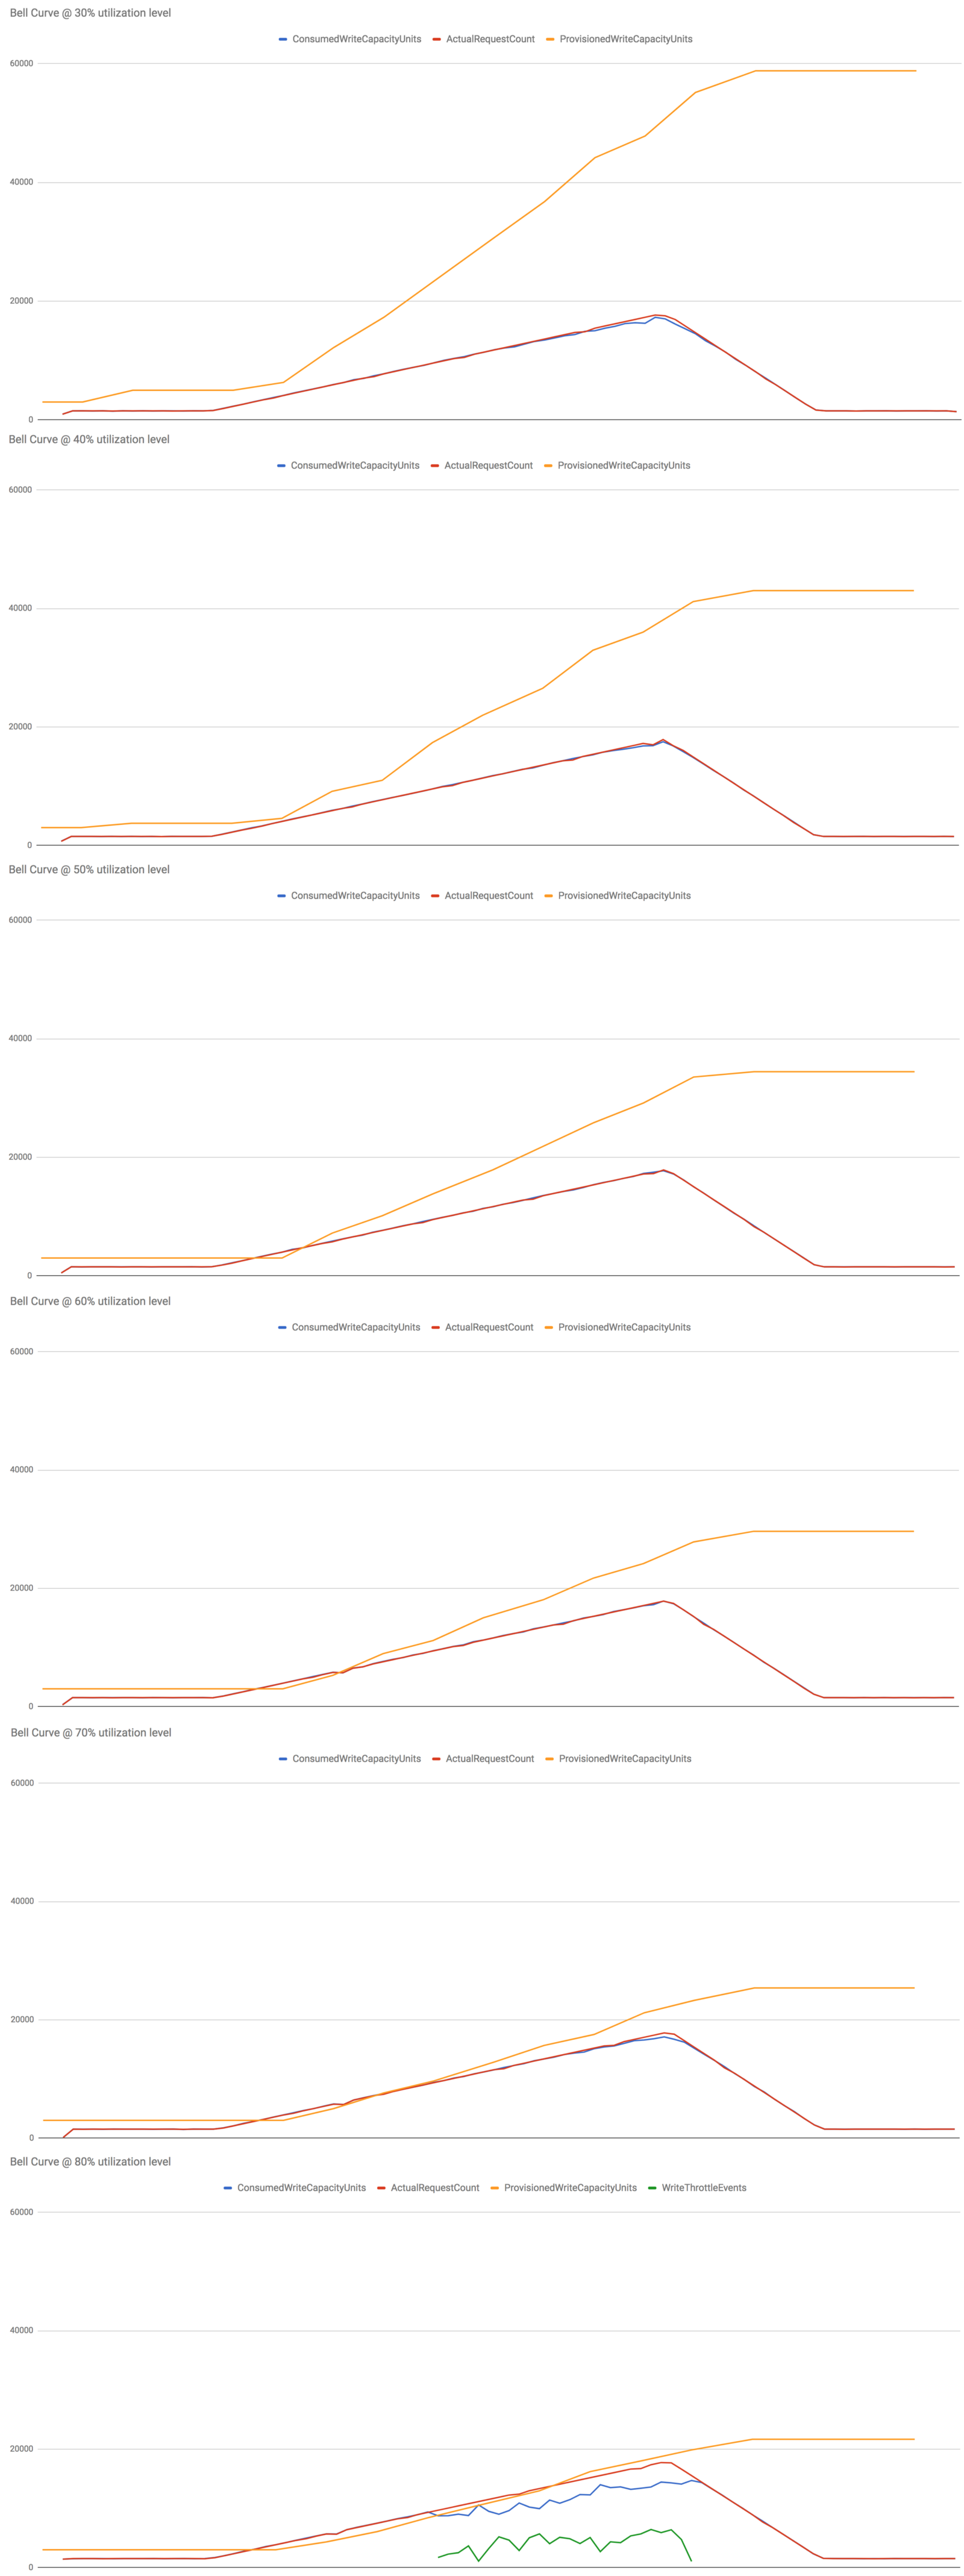
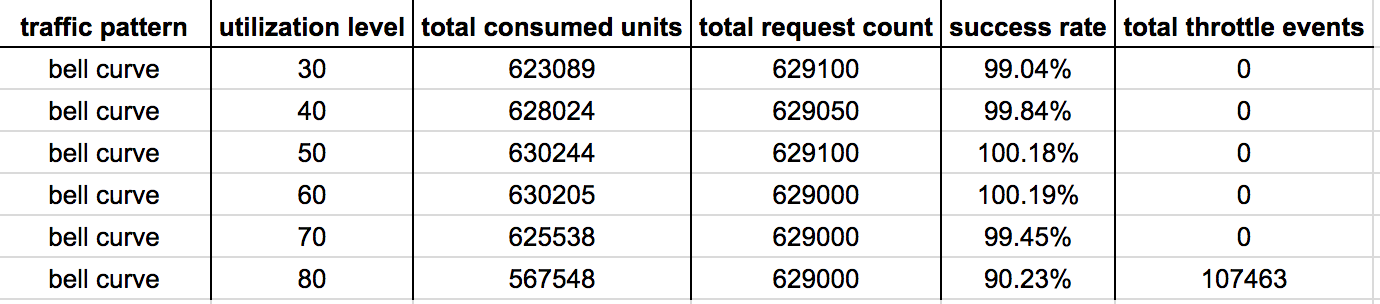
Let’s start by seeing how the control group (vanilla DynamoDB auto scaling) performed at different utilization levels from 30% to 80%.
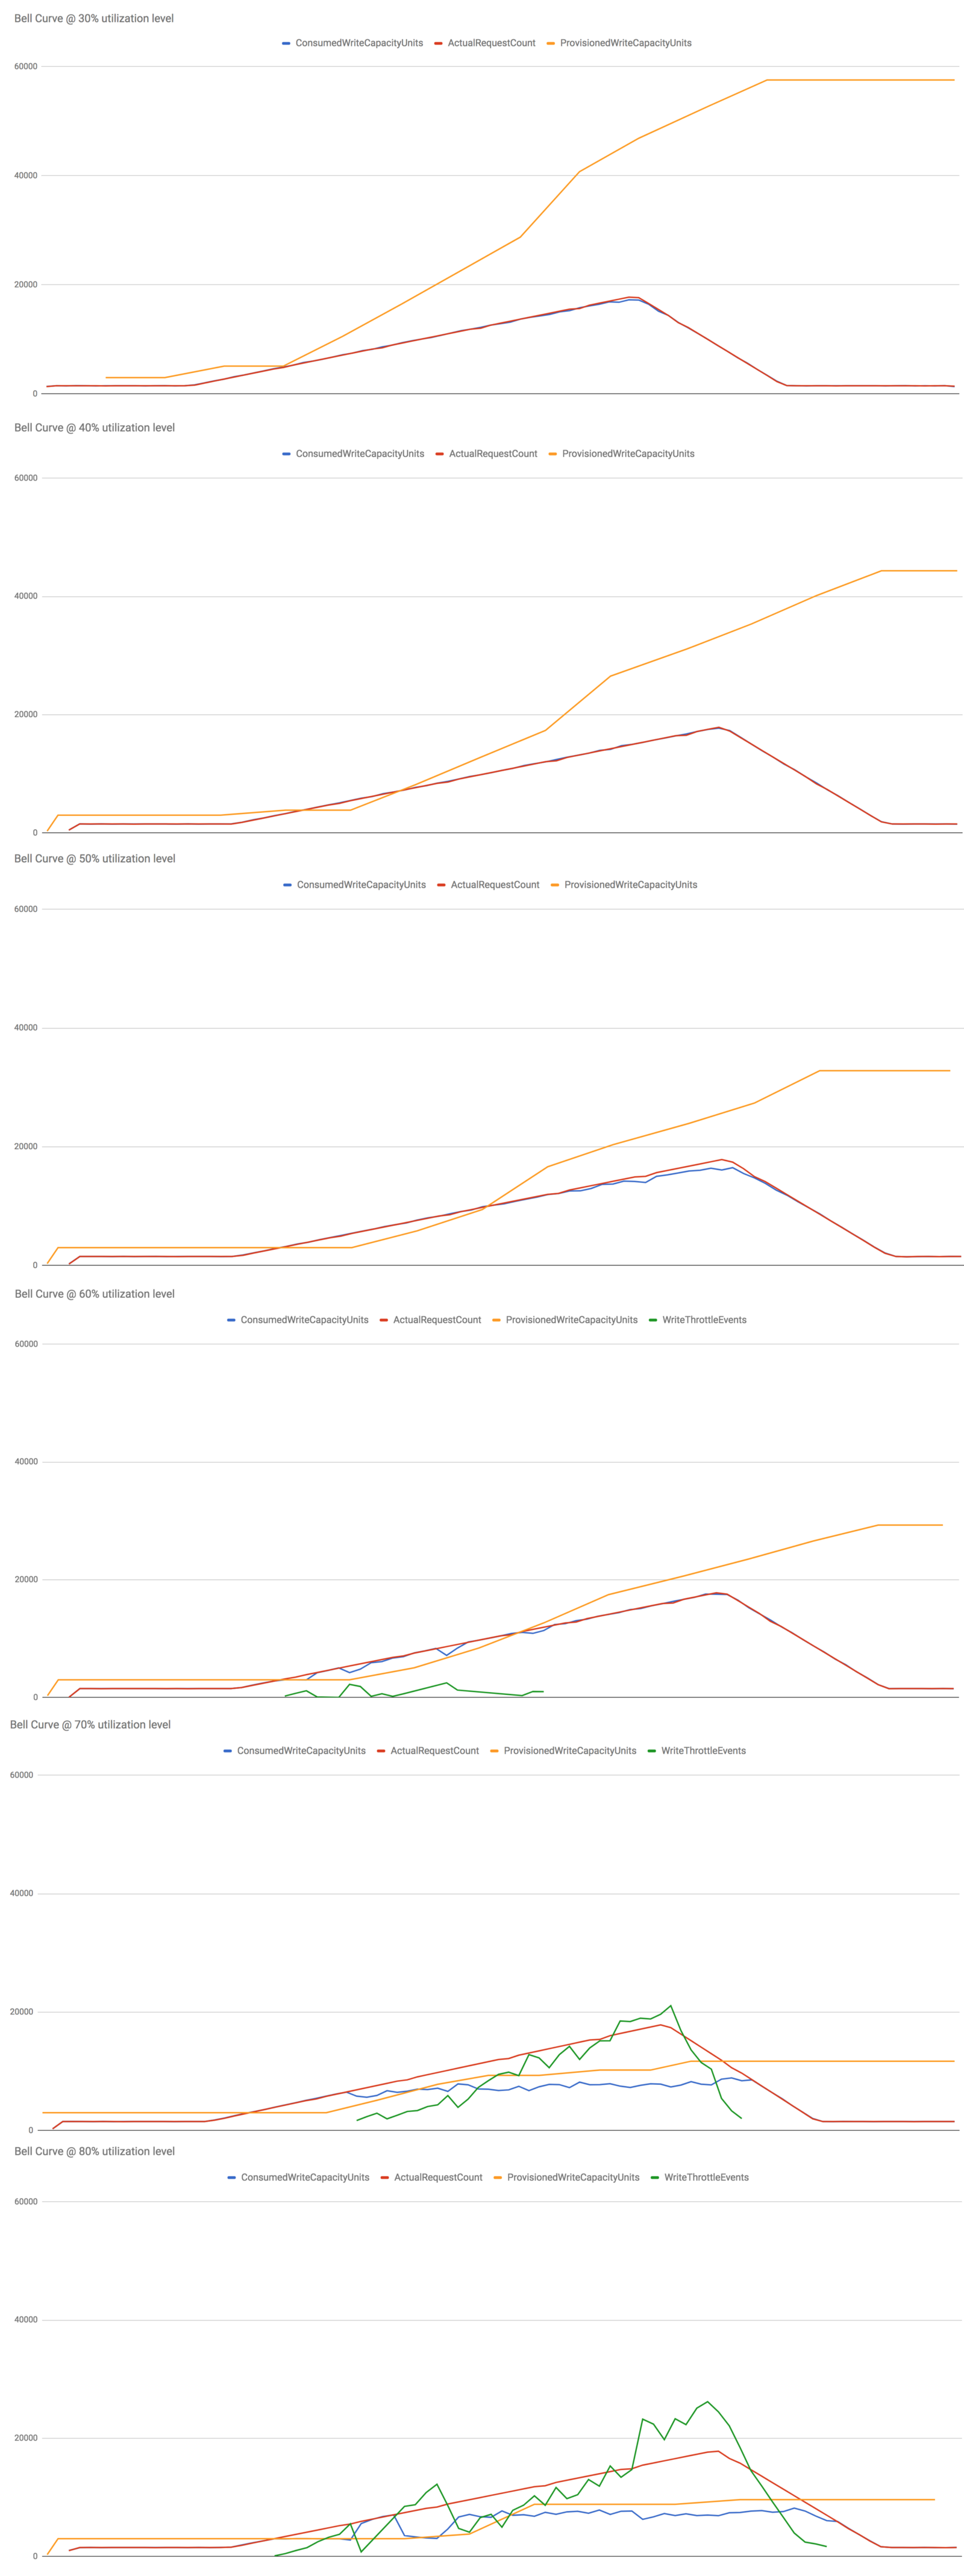
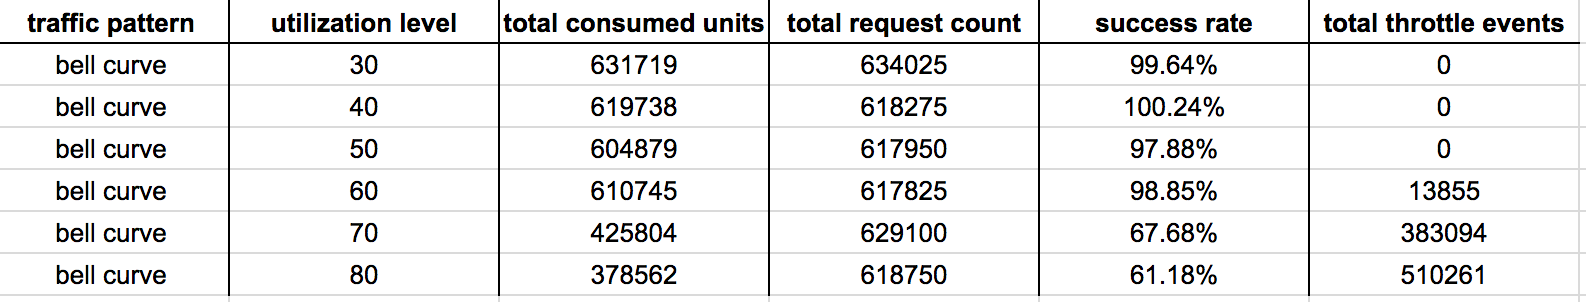
I make several observations from these results:
- At 30%-50% utilization levels, write ops are never throttled – this is what we want to see in production.
- At 60% utilization level, the slow reaction time (problem 1) caused writes to be throttled early on as the system adjust to the steady increase in load but it was eventually able to adapt.
- At 70% and 80% utilization level, things really fell apart. The growth in the actual request count outpaced the growth of consumed capacity units, more and more write ops were throttled as the system failed to adapt to the new level of actual utilization (as opposed to “allowed”utilization measured by consumed capacity units, ie problem 2).
Hypothesis 1 : scaling after 1 min breach
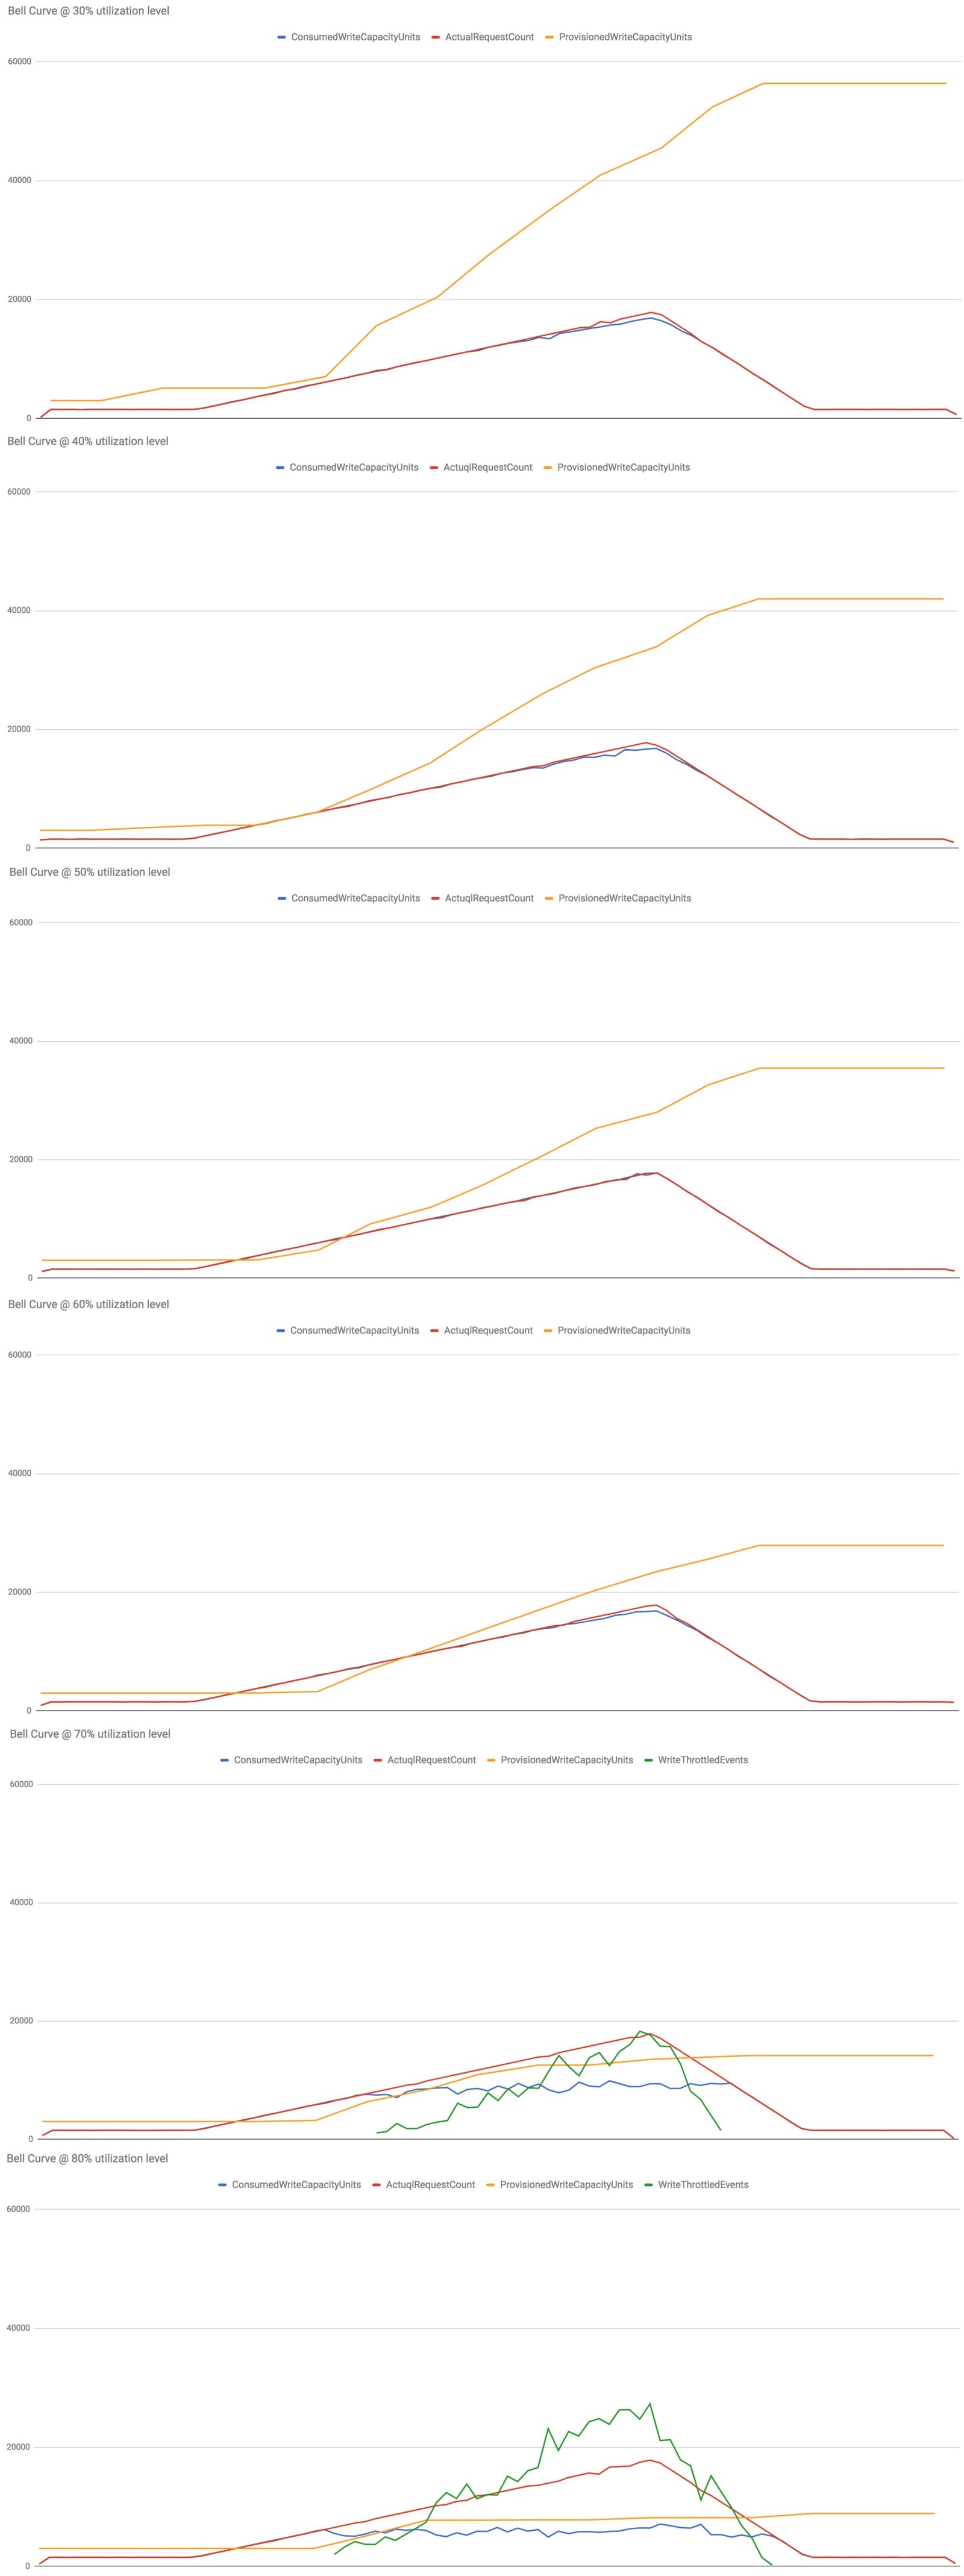
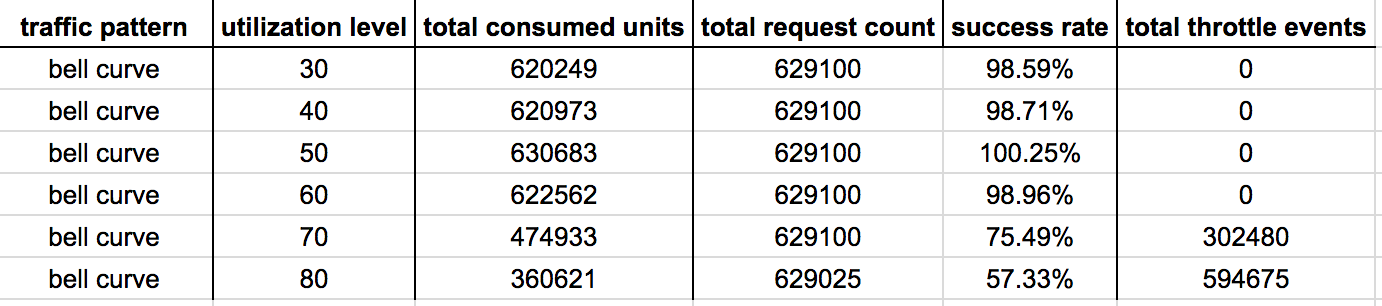
Some observations:
- At 30%-50% utilization level, there’s no difference to performance.
- At 60% utilization level, the early throttled writes we saw in the control group is now addressed as we decreased the reaction time of the system.
- At 70%-80% utilization levels, there is negligible difference in performance. This is to be expected as the poor performance in the control group is caused by problem 2, so improving reaction time alone is unlikely to significantly improve performances in these cases.
Hypothesis 2 : scaling after 1 min breach on actual request count
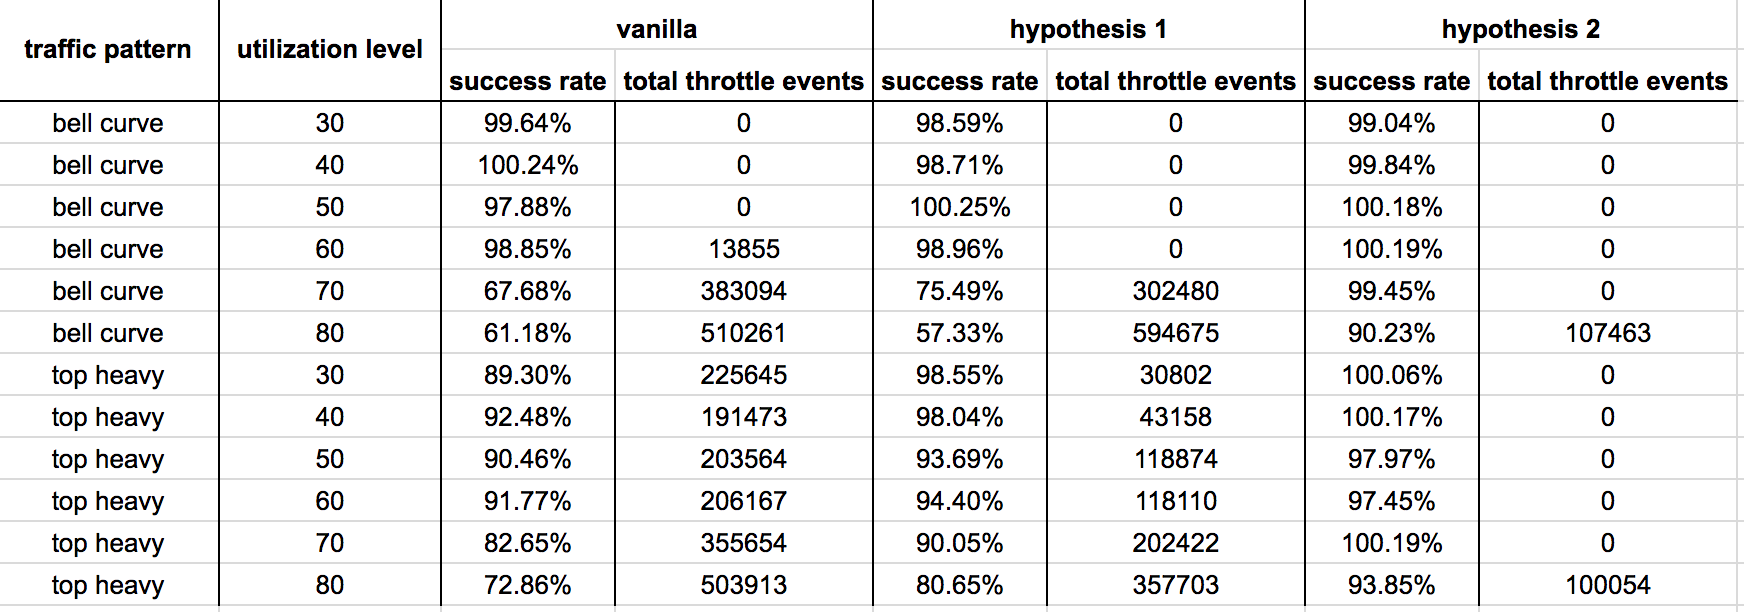
Scaling on actual request count and using actual request count to calculate the new provisioned capacity units yields amazing results. There were no throttled events at 30%-70% utilization levels.
Even at 80% utilization level both the success rate and total no. of throttled events have improved significantly.
This is an acceptable level of performance for an autoscaling system, one that I’ll be happy to use in a production environment. Although, I’ll still lean on the side of caution and choose a utilization level at or below 70% to give the table enough headroom to deal with sudden spikes in traffic.
Results (Top Heavy)
The test is setup as following:
- table starts off with 50 write capacity unit
- traffic holds steady for 15 mins at 25 writes/s
- traffic then jumps to peak level (300 writes/s) at a steady rate over the next 5 mins
- traffic then decreases at a rate of 3 writes/s per minute
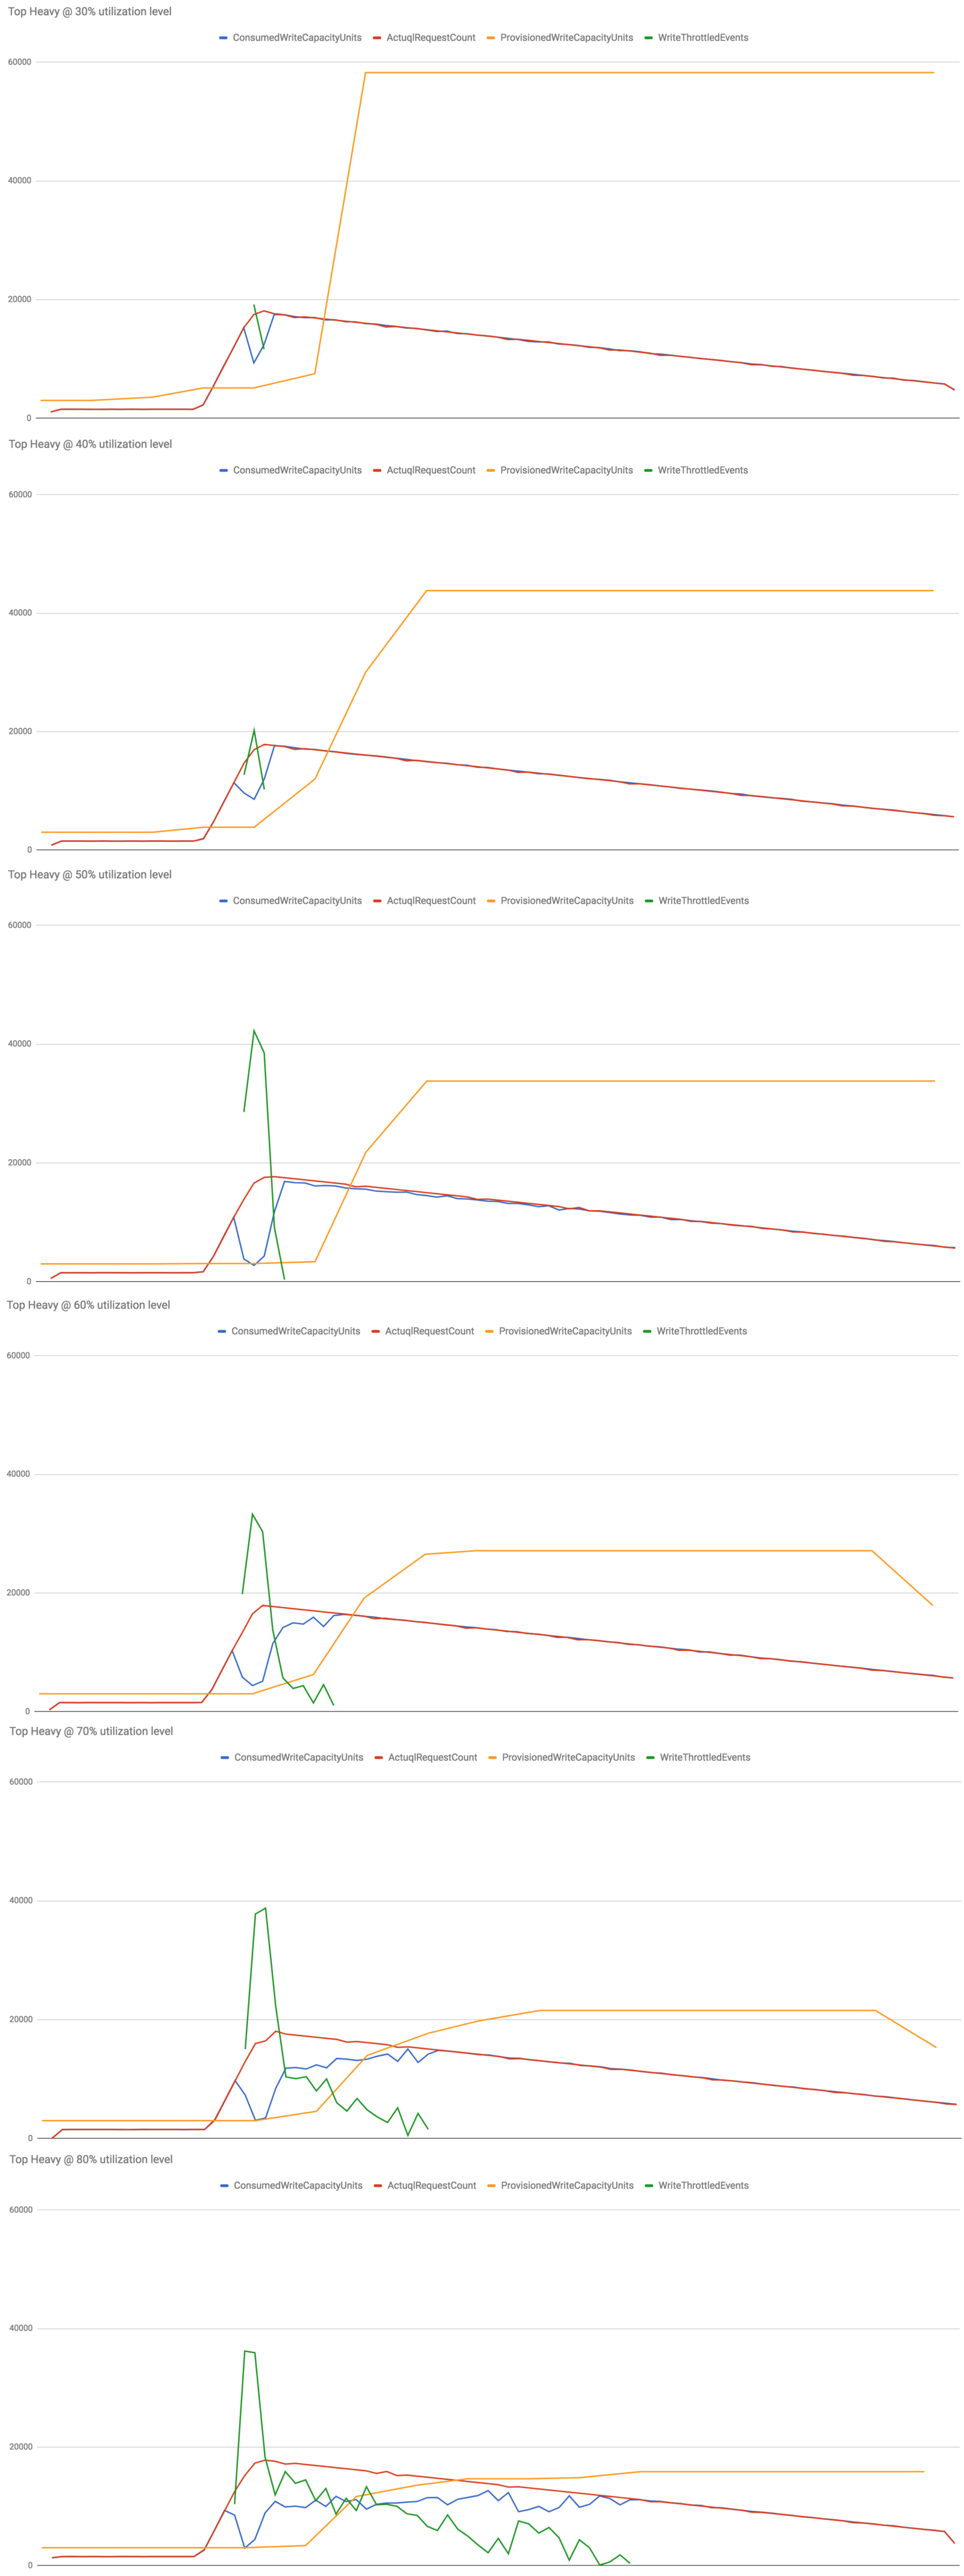
Once again, let’s start by looking at the performance of the control group (vanilla DynamoDB auto scaling) at various utilization levels.
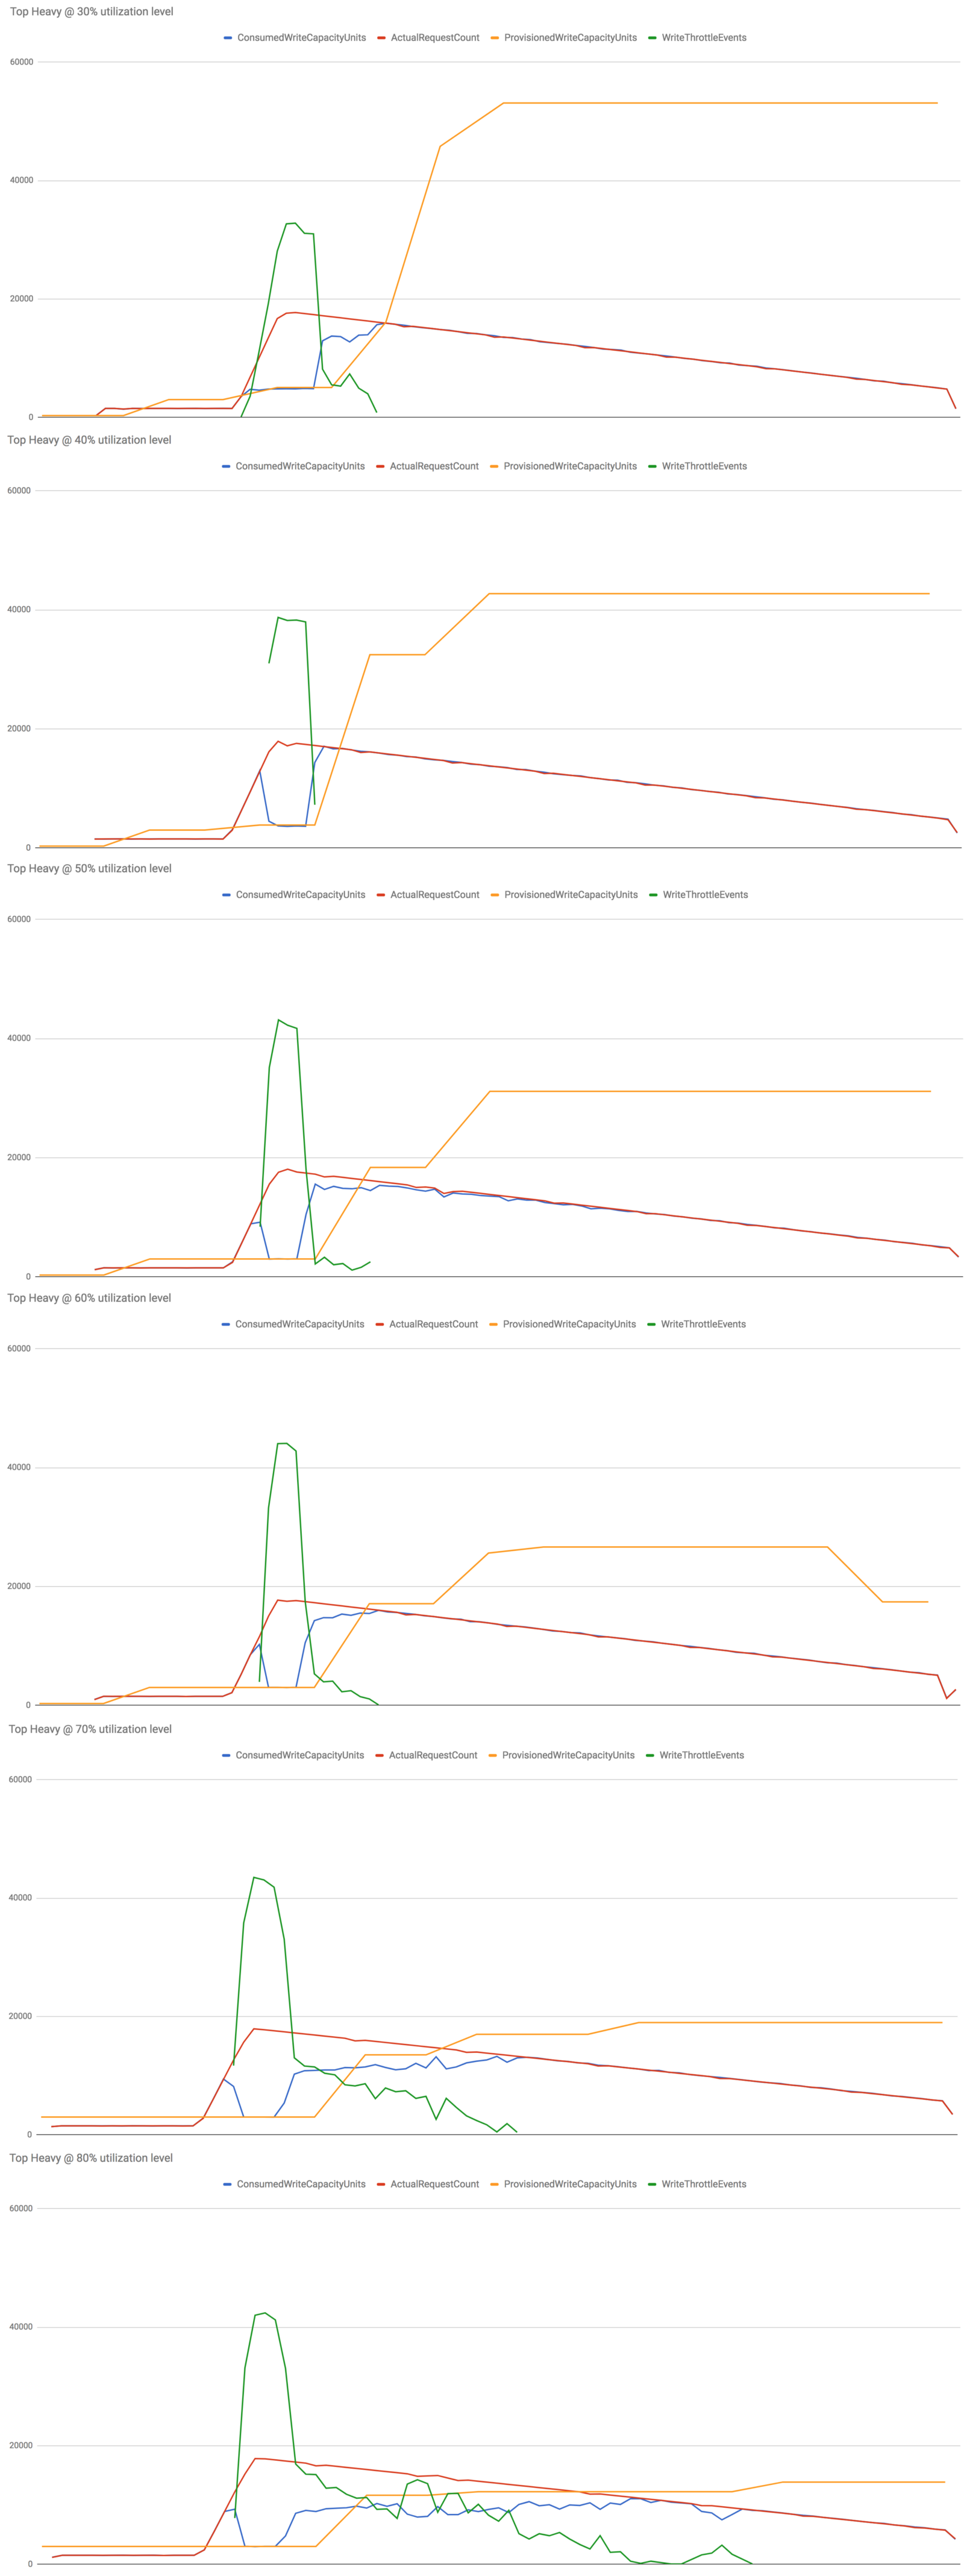
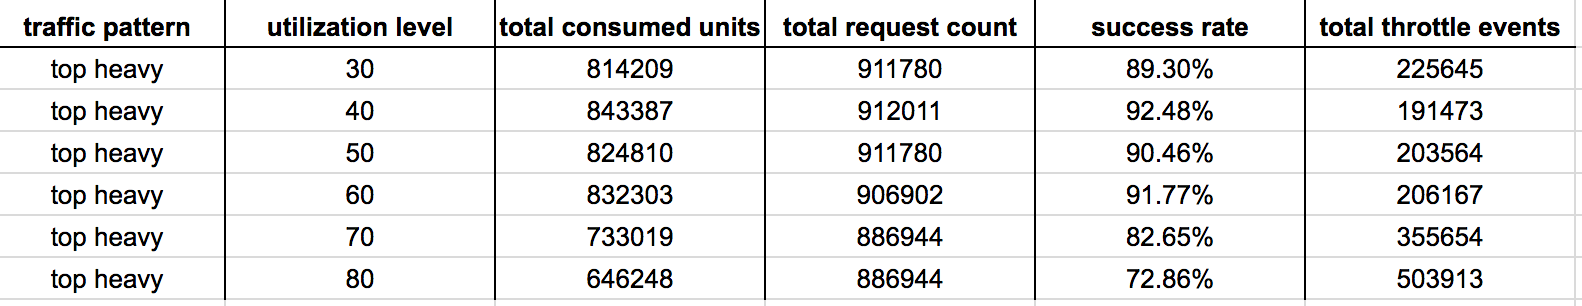
Some observations from the results above:
- At 30%-60% utilization levels, most of the throttled writes can be attributed to the slow reaction time (problem 1). Once the table started to scale up the no. of throttled writes quickly decreased.
- At 70%-80% utilization levels, the system also didn’t scale up aggressively enough (problem 2). Hence we experienced throttled writes for much longer, resulting in a much worse performance overall.
Hypothesis 1 : scaling after 1 min breach
Some observations:
- Across the board the performance has improved, especially at the 30%-60% utilization levels.
- At 70%-80% utilization levels we’re still seeing the effect of problem 2 – not scaling up aggressively enough. As a result, there’s still a long tail to the throttled write ops.
Hypothesis 2 : scaling after 1 min breach on actual request count
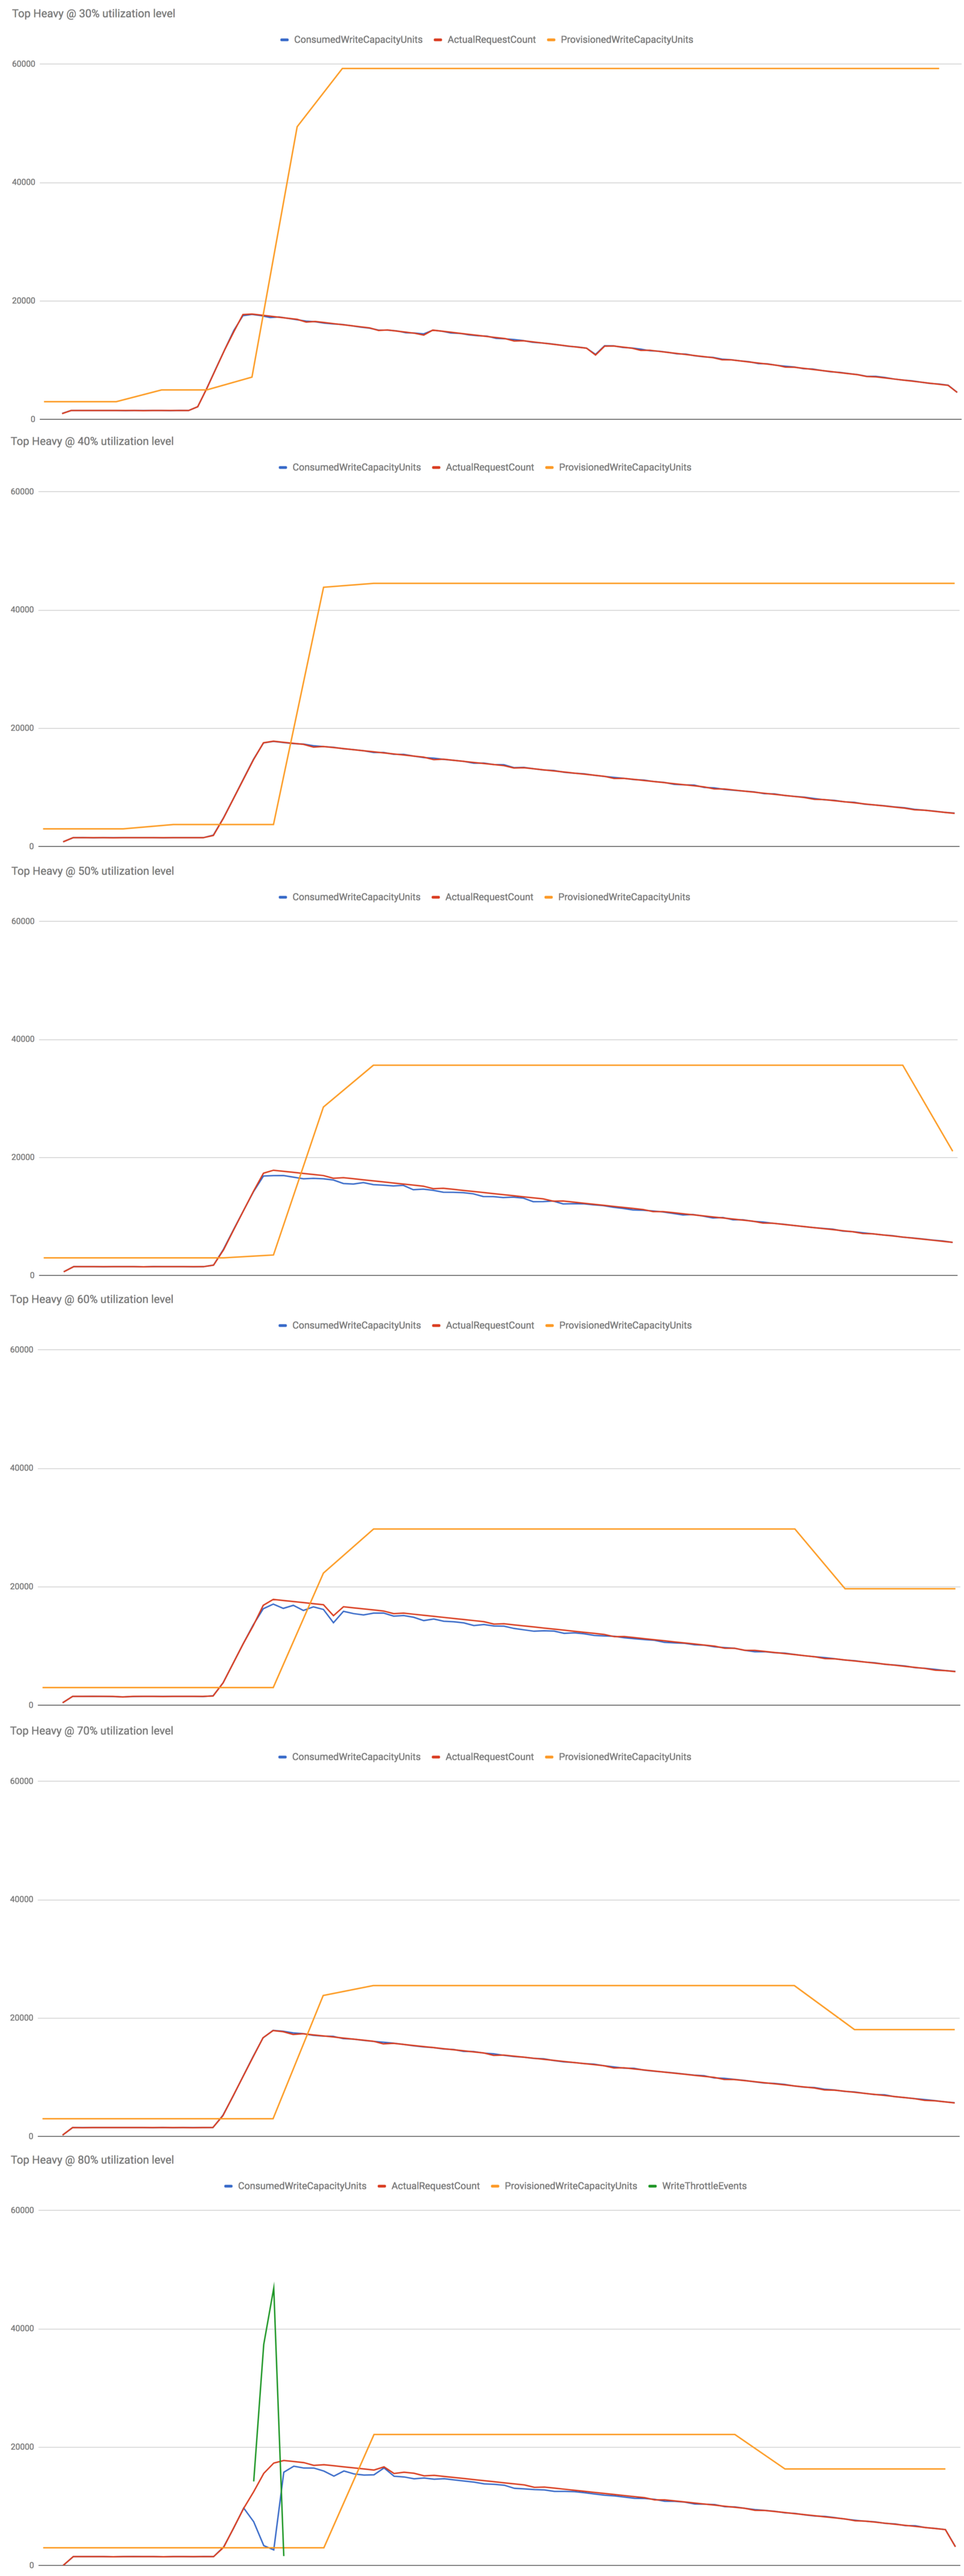
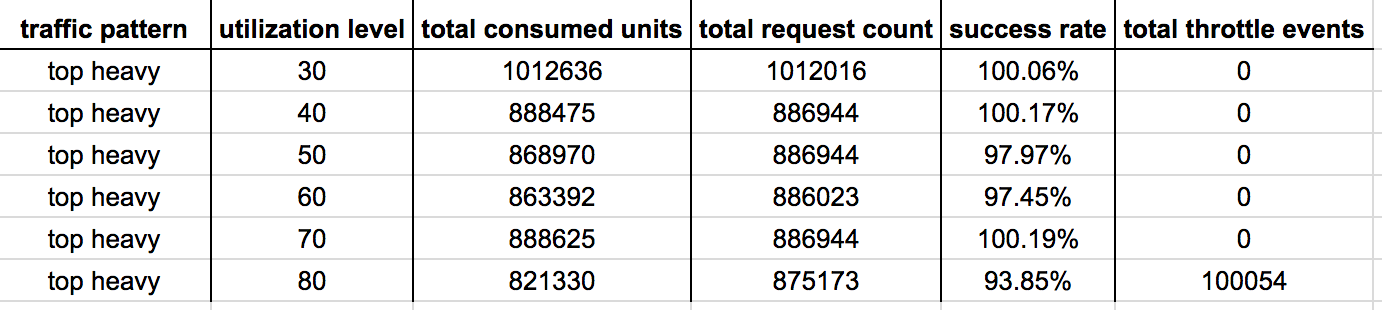
Similar to what we observed with the Bell Curve traffic pattern, this implementation is significantly better at coping with sudden spikes in traffic at all utilization levels tested.
Even at 80% utilization level (which really doesn’t leave you with a lot of head room) an impressive 94% of write operations succeeded (compared with 73% recorded by the control group). Whilst there is still a significant no. of throttled events, it compares favourably against the 500k+ count recorded by the vanilla DynamoDB auto scaling.
Conclusions
I like DynamoDB, and I would like to use its auto scaling capability out of the box but it just doesn’t quite match my expectations at the moment. I hope someone from AWS is reading this, and that this post provides sufficient proof (as you can see from the data below) that it can be vastly improved with relatively small changes.
Feel free to play around with the demo, all the code is available here.
Whenever you’re ready, here are 3 ways I can help you:
- Production-Ready Serverless: Join 20+ AWS Heroes & Community Builders and 1000+ other students in levelling up your serverless game. This is your one-stop shop for quickly levelling up your serverless skills.
- I help clients launch product ideas, improve their development processes and upskill their teams. If you’d like to work together, then let’s get in touch.
- Join my community on Discord, ask questions, and join the discussion on all things AWS and Serverless.