
Yan Cui
I help clients go faster for less using serverless technologies.
[update 23/07/2018]: The approach outlined in this post works well when you start out, but you can run into concurrency related issues at scale. To see a better approach when running at scale, please see the revised version of this post here.
CloudWatch Logs is hardly the ideal fit for all your logging needs, fortunately you can easily stream the logs to your preferred log aggregation service with AWS Lambda functions.
This is the first of a 3-part mini series on managing your AWS Lambda logs. In part 1 we will look at how you can get all of your logs off CloudWatch.
Part 2 will help you better understand the tradeoffs with different approaches to logging & monitoring, with some helpful tips and tricks that I have come across.
Part 3 will demonstrate how to capture and forward correlation IDs through various event sources – eg. API Gateway, SNS and Kinesis.
part 2 : tips and tricks
part 3 : tracking correlation IDs
AWS Lambda logging basics
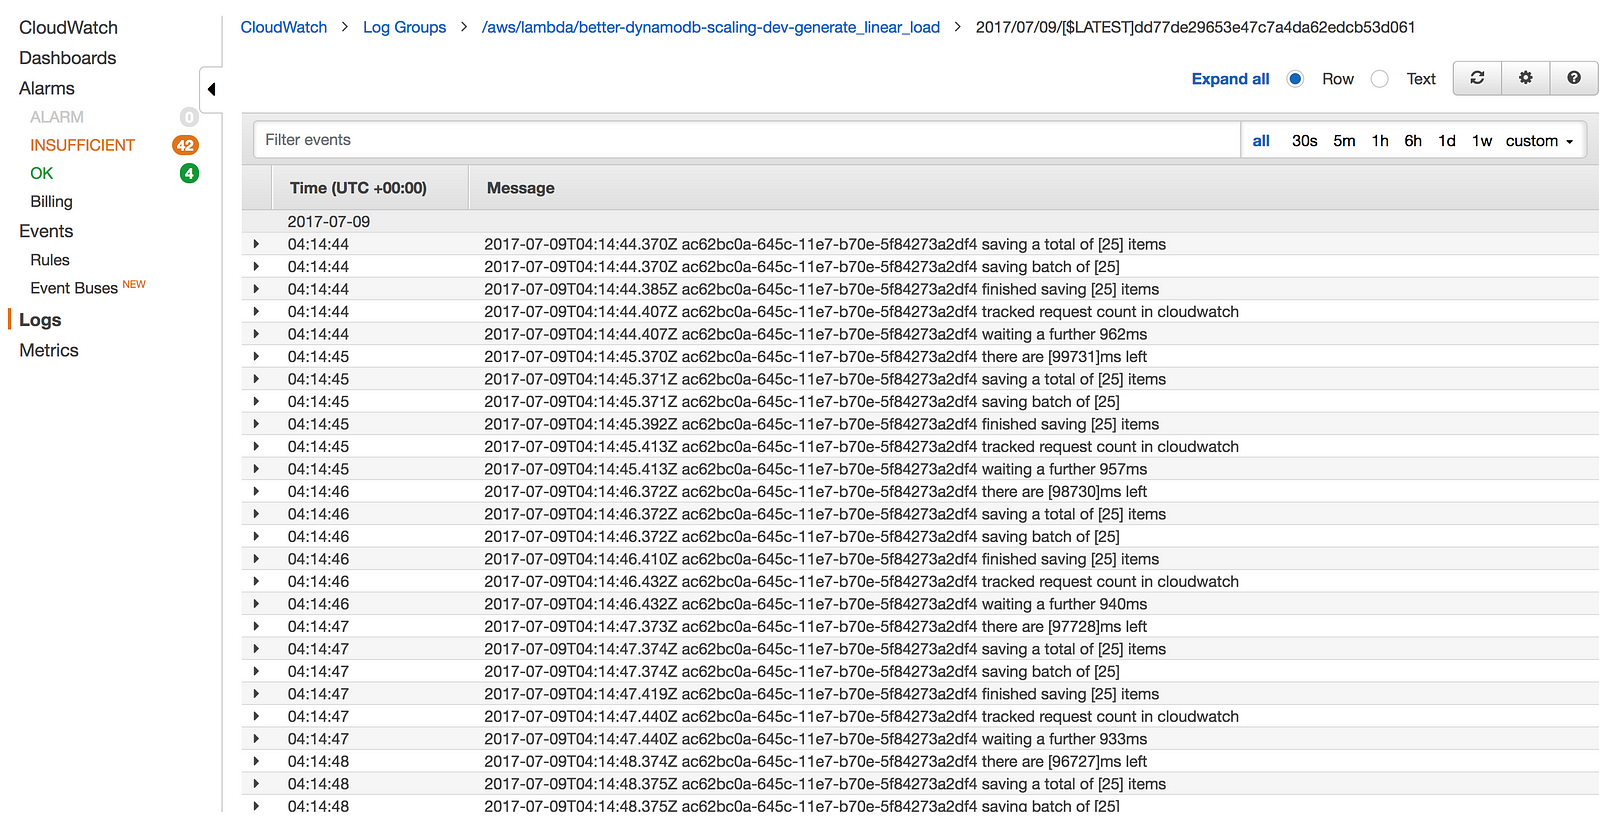
During the execution of a Lambda function, whatever you write to stdout (eg. using console.log in Node.js) will be captured by Lambda and sent to CloudWatch Logs asynchronously in the background, without adding any overhead to your function execution time.
You could, of course, send these logs to CloudWatch Logs yourself via the PutLogEvents operation, or send them to your preferred log aggregation service such as Splunk or Elasticsearch. But, remember that everything has to be done during a function’s invocation. If you’re making additional network calls during the invocation then you’ll pay for those additional execution time, and your users would have to wait that much longer for the API to respond.
So, don’t do that!
Instead, process the logs from CloudWatch Logs after the fact.
Streaming CloudWatch Logs
In the CloudWatch Logs console, you can select a log group (one for each Lambda function) and choose to stream the data directly to Amazon’s hosted Elasticsearch service.
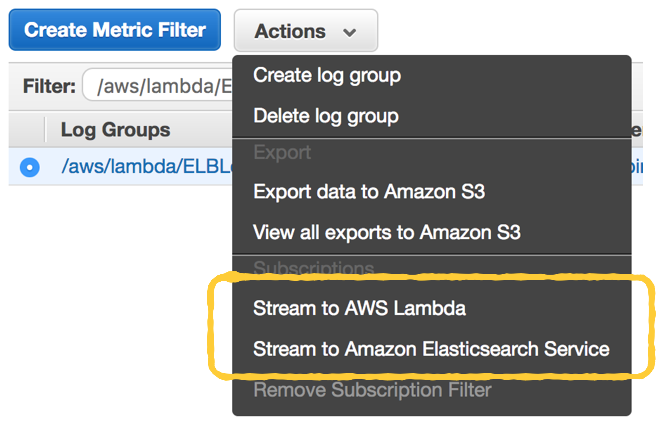
This is very useful if you’re using the hosted Elasticsearch service already. But if you’re still evaluating your options, then give this post a read before you decide on the AWS-hosted Elasticsearch.
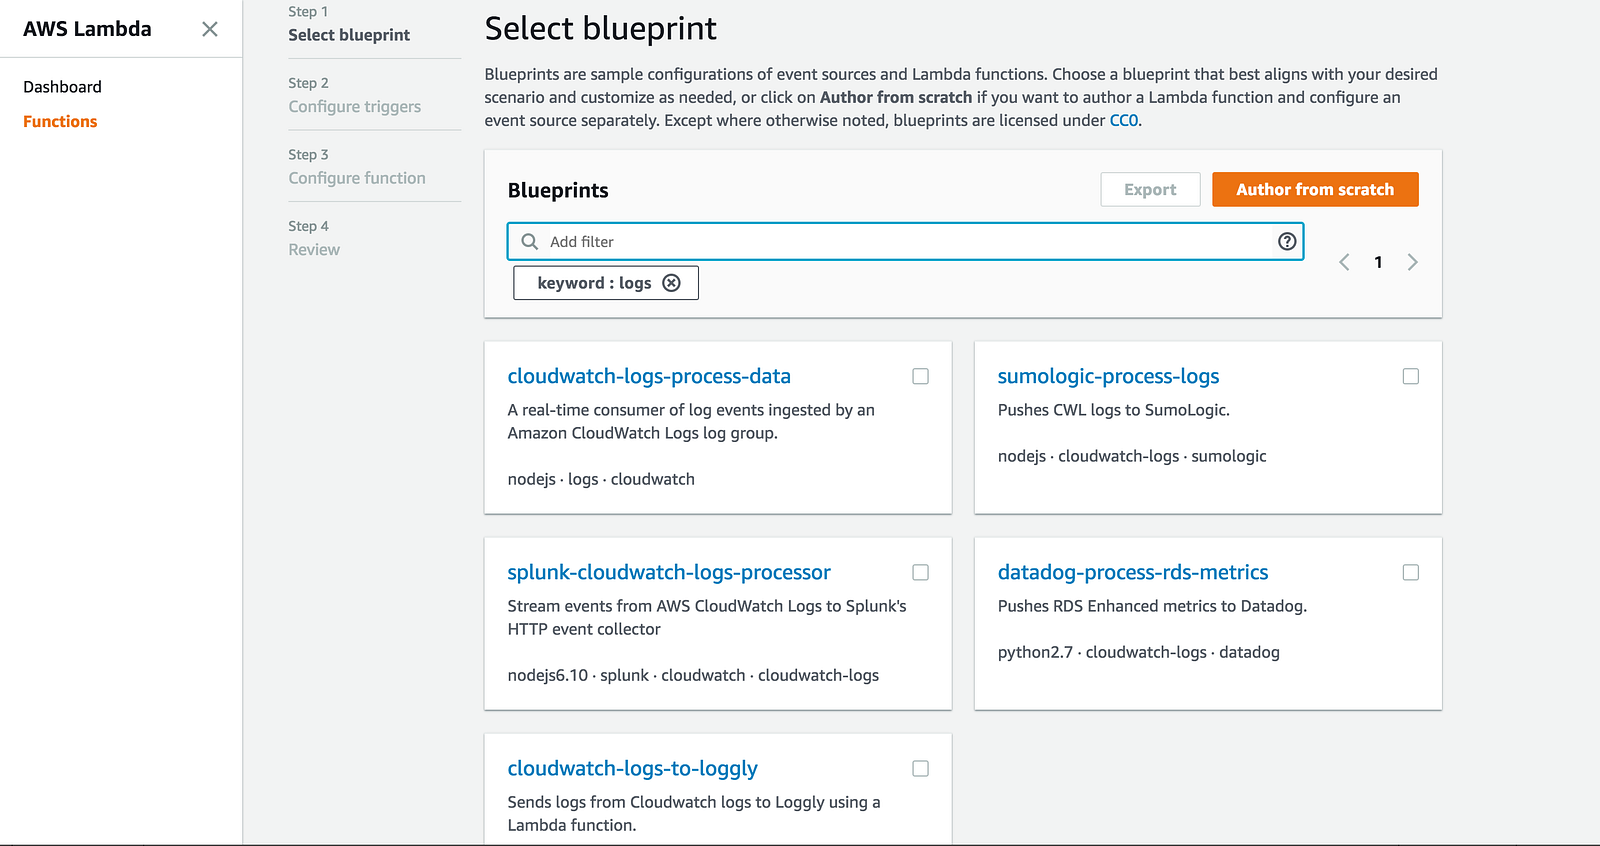
As you can see from the screenshot above, you can also choose to stream the logs to a Lambda function instead. In fact, when you create a new function from the Lambda console, there’s a number of blueprints for pushing CloudWatch Logs to other log aggregation services already.
Clearly this is something a lot of AWS’s customers have asked for.
So that’s great, now you can use these blueprints to help you write a Lambda function that’ll ship CloudWatch Logs to your preferred log aggregation service. But here are a few things to keep in mind.
Auto-subscribe new log groups
Whenever you create a new Lambda function, it’ll create a new log group in CloudWatch logs. You want to avoid a manual process for subscribing log groups to your ship-logs function above.
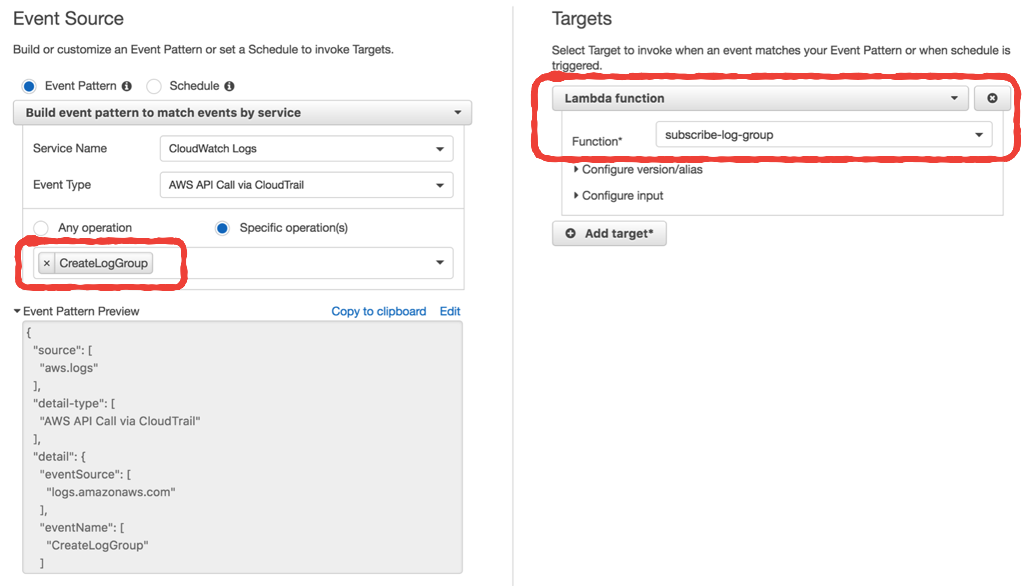
Instead, enable CloudTrail, and then setup an event pattern in CloudWatch Events to invoke another Lambda function whenever a log group is created.
You can do this one-off setup in the CloudWatch console manually.
If you’re working with multiple AWS accounts, then you should avoid making the setup a manual process. With the Serverless framework, you can setup the event source for this subscribe-log-group function in the serverless.yml file.
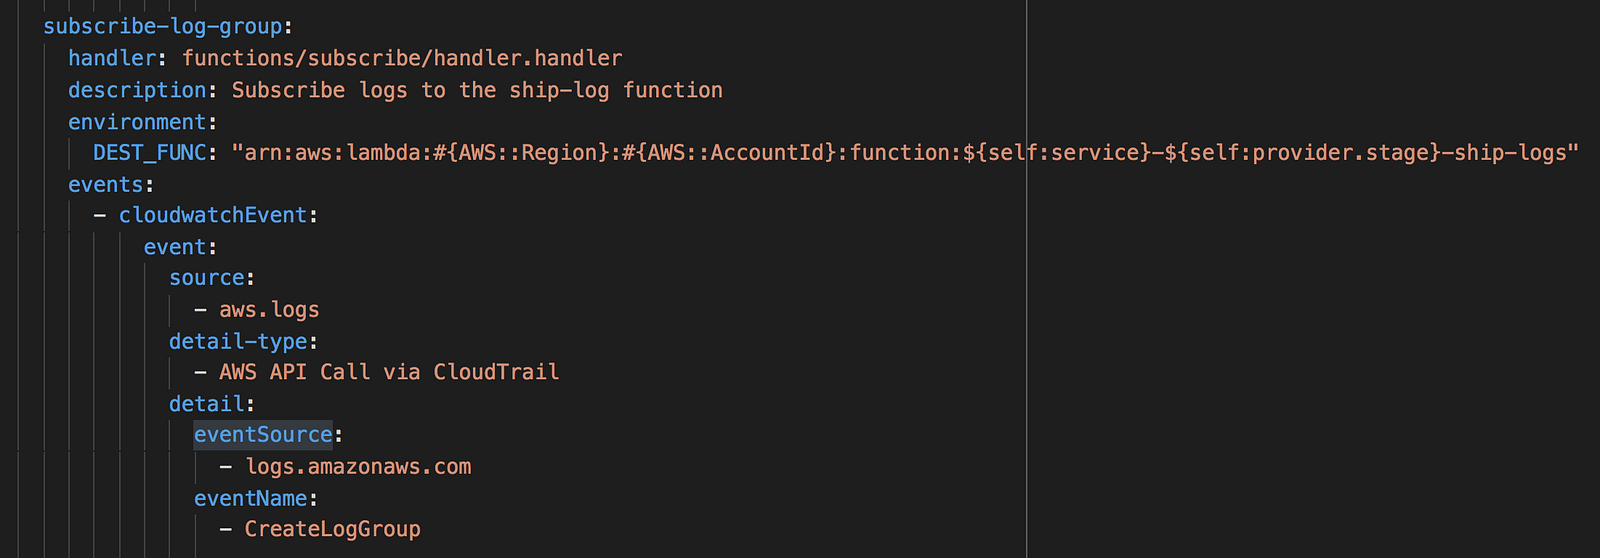
Another thing to keep in mind is that, you need to avoid subscribing the log group for the ship-logs function to itself – it’ll create an infinite invocation loop and that’s a painful lesson that you want to avoid.
Auto-setting the log retention policy
By default, when Lambda creates a new log group for your function the retention policy is to keep them forever. Understandably this is overkill and the cost of storing all these logs can add up over time. 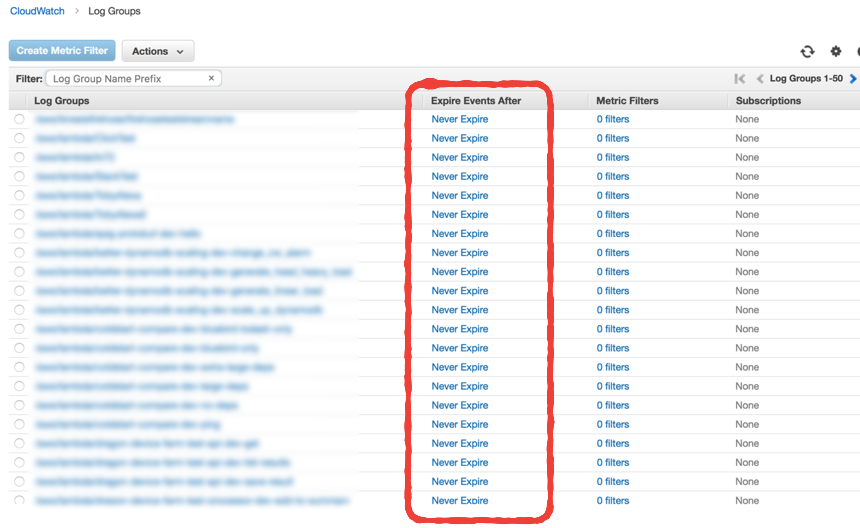
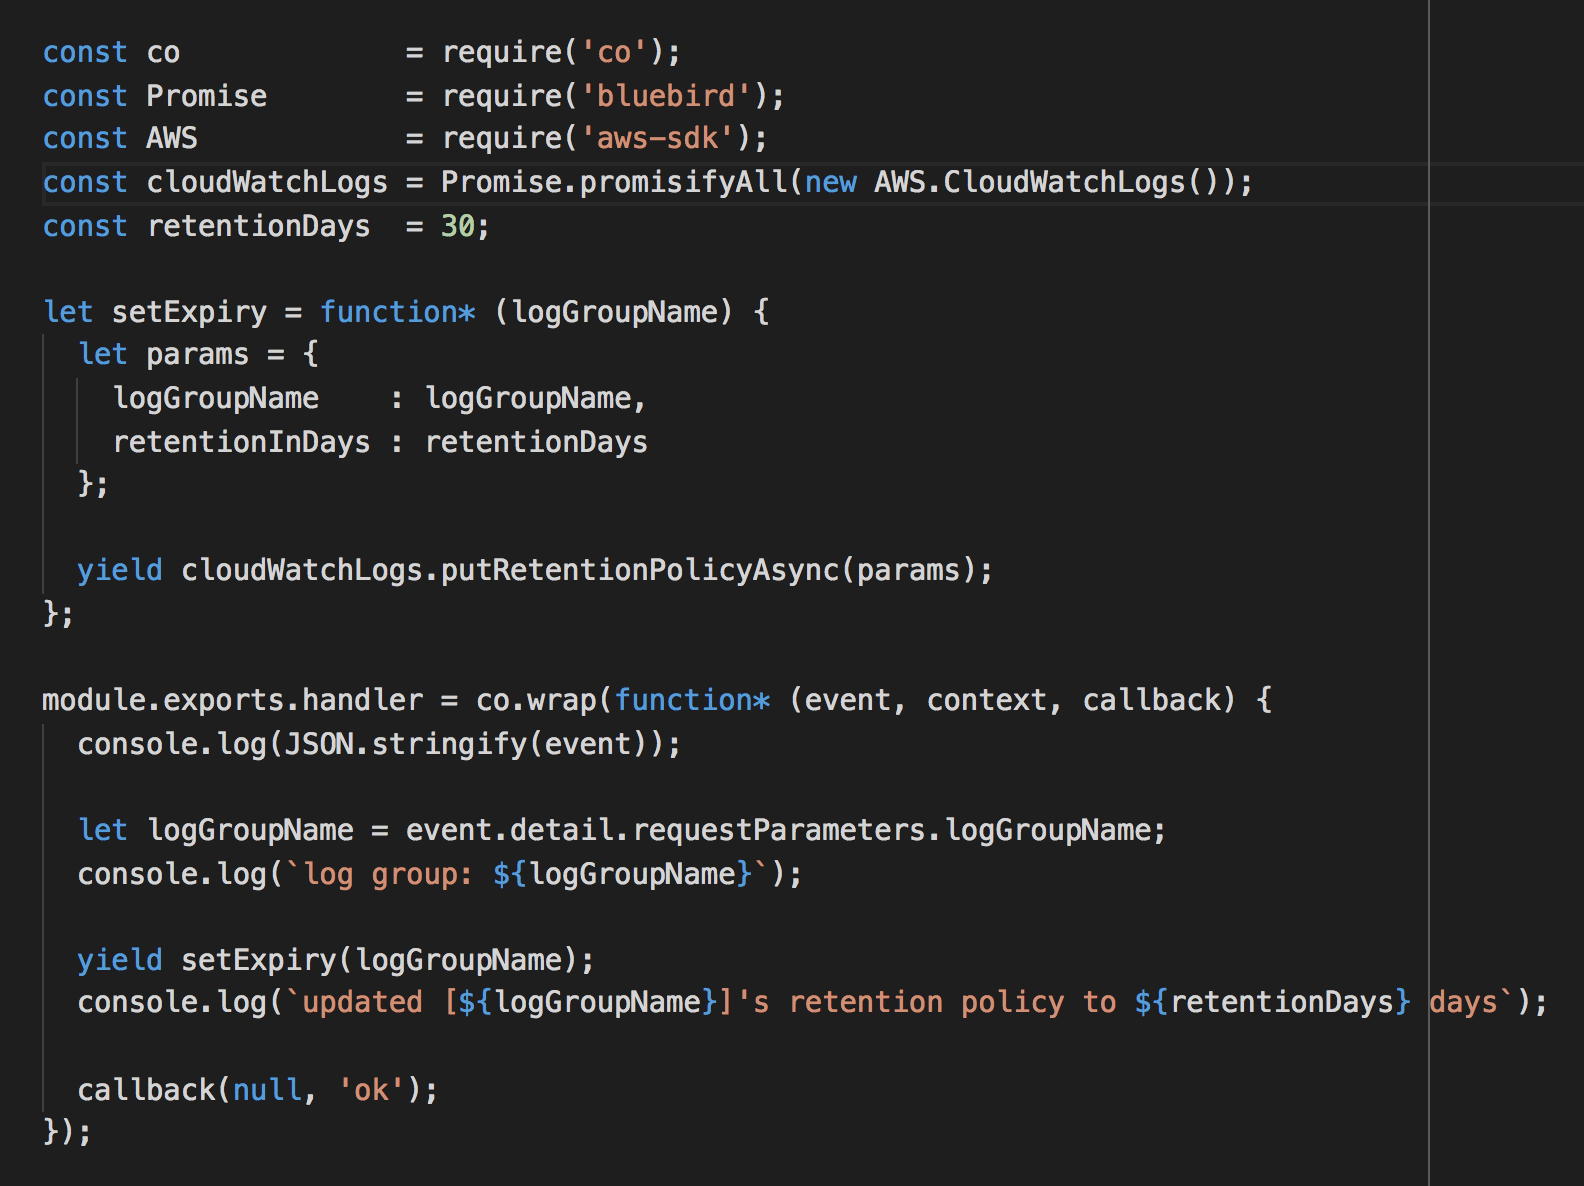
Fortunately, using the same technique above we can add another Lambda function to automatically update the retention policy to something more reasonable.
Taking care of existing log groups
If you already have lots of existing log groups, then consider wrapping the demo code (below) for auto-subscribing log groups and auto-updating log retention policy into a one-off script to update them all.
You can do this by recursing through all log groups with the DescribeLogGroups API call, and then invoke the corresponding functions for each log group.
You can find example code in this repo.
Whenever you’re ready, here are 3 ways I can help you:
- Production-Ready Serverless: Join 20+ AWS Heroes & Community Builders and 1000+ other students in levelling up your serverless game. This is your one-stop shop for quickly levelling up your serverless skills.
- I help clients launch product ideas, improve their development processes and upskill their teams. If you’d like to work together, then let’s get in touch.
- Join my community on Discord, ask questions, and join the discussion on all things AWS and Serverless.
Great article, and agree it’s pretty easy to send AWS Logs using Loggly, here’s the link. https://www.loggly.com/blog/sending-aws-cloudwatch-logs-to-loggly-with-aws-lambda/
Pingback: Tips and tricks for logging and monitoring AWS Lambda functions | theburningmonk.com
Pingback: Capture and forward correlation IDs through different Lambda event sources | theburningmonk.com
when I add a new function in `serverless.yml` is it supposed to it to be automatically subscribed to stream?
With the setup outlined in this post, any log groups created for new functions would be automatically subscribed to the “ship-logs” function (I assume that’s what you meant by “stream”?)
So if you add a new function to your serverless.yml, let’s called “hello-world-dev-function2”, (assuming the standard naming convention serverless uses) deploy it, then you should see a new log group called “/aws/lambda/hello-world-dev-function2” appear in CloudWatch Logs.
It might take a minute, but CloudWatch Event would eventually invoke the “subscribe” function above, which would then subscribe this log group to our “ship-logs” function.
The event syntax doesn’t seem to work anymore. At least my function doesn’t get called when a cloudwatch stream is created and I made a very minimal example with just the event. Did the event syntax possibly change? Is there an extra step I am missing?
Considering now to put the subscription updating on a schedule…
The event syntax hasn’t changed AFAIK, you might be missing the serverless-pseudo-parameters plugin, which is used to construct the ARN for the ship-logs function (see the plugins section in the repo https://github.com/theburningmonk/lambda-logging-demo/blob/master/serverless.yml). You need to first install the plugin with NPM install.
Also, the subscription only happens when the CreateLogGroup API is called (ie. when a new Lambda function is created), not when a new log stream is created inside the group.
My understanding is that I don’t need the ship-logs function ARN to subscribe a function to the specific cloud watch event.
I’m literally just creating a function “echo-create-log-group-event” containing a console log and subscribing it to the couldwatch event (identical to the set-retention function subscription here https://github.com/theburningmonk/lambda-logging-demo/blob/master/serverless.yml).
However according to the cloudwatch log stream of “echo-create-log-group-event” it is never triggered (even when I create an entirely new lambda function).
Wondering what I’m doing wrong… Will get back if I find a solution.
I’ve put this all together into a standalone, easy-to-deploy, zero integration solution here: https://github.com/simlu/lambda-monitor/ Hoping this will be useful for other people as well.
I was not able to trigger lambda functions on cloudwatch group creation as to your example. Would you mind taking a quick look?
Hi Lukas,
Looking at your solution, you’re using a custom CloudFormation resource TriggerLambdaResource which I have not come across before. How does it work?
I take it you’ve tried the CloudWatch event pattern I mentioned in the post and couldn’t get that to work? You might have to wait a few mins for the CloudWatch event to trigger the subscribe and set-retention functions as CloudTrail can be a few minutes behind.
Hello,
The custom resource just makes sure the subscribe lambda function gets executed on initial deploy. Those are the three use-cases we need to support for lambda (1) when new stream is created (2) on initial deploy and (3) periodically in case something went horribly wrong.
That is correct. I can do a pr and you can take a look at why that might not work. This should be very simple and I’m confused why it doesn’t seem to work. Let me get back to you here with a pr.
Cheers, L~
I’ve opened up a pr and confirmed that it is still not working: https://github.com/simlu/lambda-monitor/pull/42/files
Would you mind taking a look? Cheers
I think my problem is with the point “enable CloudTrail”. Would you mind explaining what you did there in detail?
Lukas – have a look at the CloudTrail docs on getting started: http://docs.aws.amazon.com/awscloudtrail/latest/userguide/turn-on-cloudtrail-in-additional-accounts.html
Essentially you need to enable the service and tell it what S3 bucket to use to store the events (eg. the API call to CloudWatch to CreateLogGroup).
I’m still not sure what to do here. Is this necessary or overly complex:
http://docs.aws.amazon.com/lambda/latest/dg/with-cloudtrail.html
I’ve set up a bucket that receives the events, but my lambda function still doesn’t get triggered. So do I need to subscribe to the S3 write events?
Ok, I think I finally have it working in the PR referenced before. The problem now is the the cleanup. tbc…
Nvm, here is the relevant PR: https://github.com/simlu/lambda-monitor/pull/60/files
Would you mind taking a look at it? Cheers
I don’t think you should delete CloudTrail bucket after this project is removed. You should enable CloudTrail on your account irrespective of setting up auto-subscription for the log shipping function.
It enables a suite of tools/practices to audit your account and detect suspicious activities.
This talk from re:invent just gone is worth a watch if you wanna learn more about what you can do with CloudTrail/AWS Config + Lambda for audit https://www.youtube.com/watch?v=oMlGHP8-yHU
I don’t disagree that it’s good practice to enable cloudtrail logging to s3. However the goal for this project is to have an easy, totally decoupled way to do lambda function monitoring. Eventually I want to put it onto the aws serverless marketplace. So I needed a way to automatically enable the auto subscribe in all cases and when the user wants to remove the project, a way to remove all traces. Thank you for taking a look!
Hi,
Trying to deploy ship-log function, I’m getting:
Unable to import module ‘handler’: Error
at Function.Module._resolveFilename (module.js:325:15)
at Function.Module._load (module.js:276:25)
at Module.require (module.js:353:17)
at require (internal/module.js:12:17)
at Object. (/var/task/handler.js:3:20)
at Module._compile (module.js:409:26)
at Object.Module._extensions..js (module.js:416:10)
at Module.load (module.js:343:32)
at Function.Module._load (module.js:300:12)
at Module.require (module.js:353:17)
Any idea why?
I didn’t use serverless framework……
How are you deploying this function? Best to just use the serverless framework.
Hi,
I’ve actually resolved it.
Was sending the data to internal LB (Logstash is sitting behind the LB)….and the Lambda was not running in the VPC.
Now sending data to external LB and it looks to be working fine ;)
I think I’d like to keep the lambda outside of the VPC as I don’t want lambda to create ENI in the VPC every time it’s invoked.
The problem that I now face is that this LB URL (eventhough frontend is using SSL, and backend is not using SSL) is completely unsecured and if someone is browsing to this url the data is sent through.
With http input plugin I can secure it with username and password but how can I do it with tcp plugin?
Do you have a suggestion?
Hmm,
OK, so the way I’ve implemented this is (that’s the best I could come up with ;):
I’ve added a token field to lib.js and used conditional to drop the event if the “token” string is not in the “message” field:
for (let logEvent of logEvents) {
try {
let log = parse.logMessage(logEvent.message);
log.level = log.level || ‘debug’;
log.logStream = logStream;
log.logGroup = logGroup;
log.lambdaVersion = lambdaVer;
log.fields = log.fields || {};
log.type_id = “cloudwatch”;
log.token = “secretstring”;
log[‘@timestamp’] = new Date(logEvent.timestamp);
console.log(“sending : “, log);
socket.write(JSON.stringify(log) + ‘\n’);
} catch (err) {
console.log(err, err.stack);
}
}
Then in logstash in the filter section:
filter {
if ([message] !~ “secretstring”) {
drop { }
}
json {
source => “message”
}
Hi,
Do I need a different parser rules (in the ship-logs function) to ship Apache or syslog logs from Cloudwatch to Logstash?
Can there a be a generic parser?
Thanks