
Yan Cui
I help clients go faster for less using serverless technologies.
part 1 : new challenges to observability
part 2 : 1st party observability tools from AWS <- you are here
part 3 : 3rd party observability tools
part 4: the future of Serverless observability
In part 1 we talked about the challenges serverless brings to the table. In this post, let’s look at 1st party tools from AWS and see how they measure up against these new challenges:
- nowhere to install agents/daemons
- no background processing
- higher concurrency to observability system
- high chance of data loss when not sending eagerly
- hard to trace asynchronous
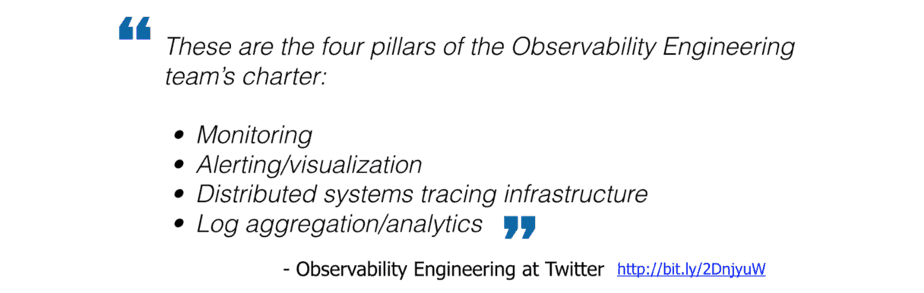
But before we start, let’s remind ourselves of the 4 pillars of observability.
Out of the box we get a bunch of tools provided by AWS itself:
- CloudWatch for monitoring, alerting and visualization
- CloudWatch Logs for logs
- X-Ray for distributed tracing
- Amazon ElasticSearch for log aggregation
CloudWatch Logs
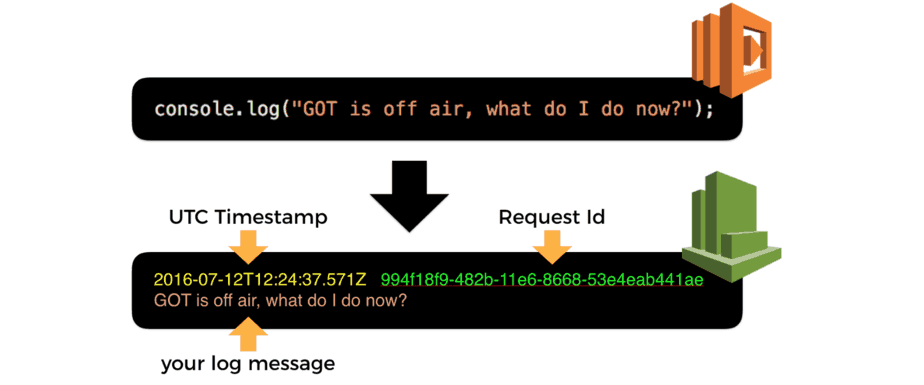
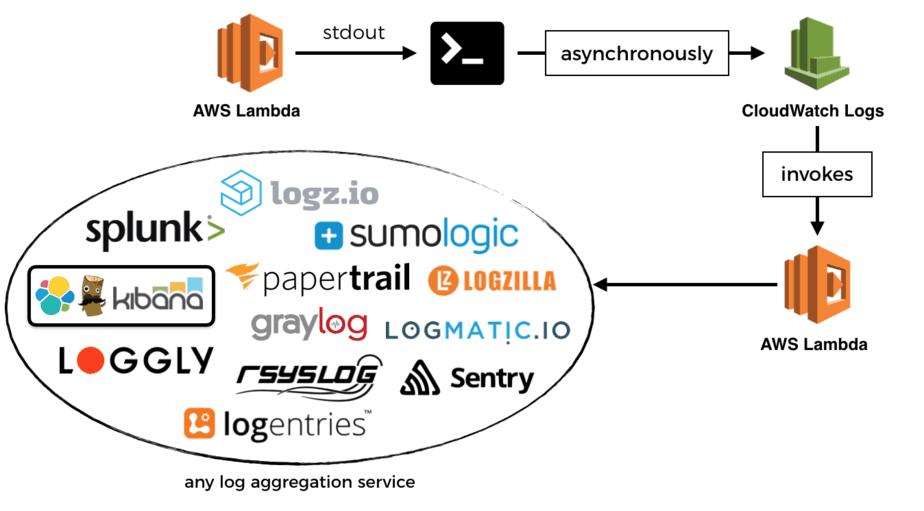
Whenever you write to stdout, those outputs are captured by the Lambda services and sent to CloudWatch Logs as logs. This is one of the few background processing you get, as it’s provided by the platform.
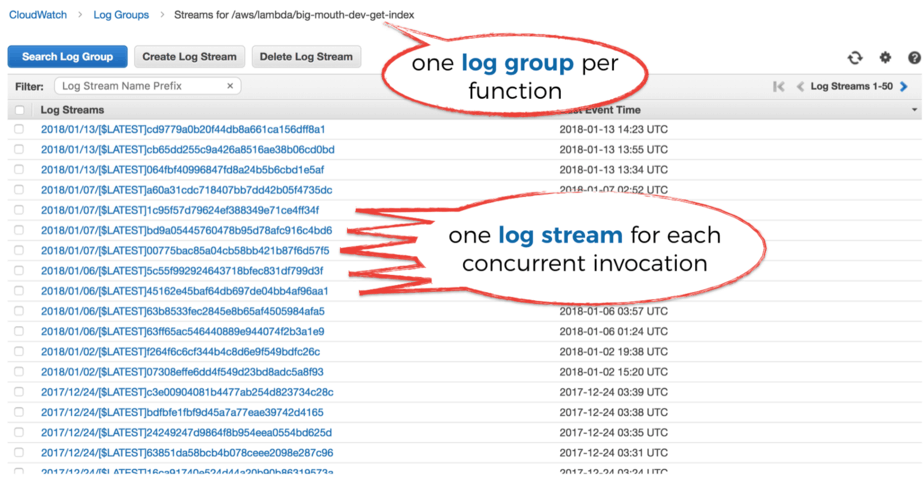
All the log messages (technically they’re referred to as events) for a given function would appear in CloudWatch Logs under a single Log Group.
As part of a Log Group, you have many Log Streams. Each contains the logs from one concurrent execution (or container) of your function, so there’s a one-to-one mapping.
So that’s all well and good, but it’s not easy to search for log messages in CloudWatch Logs. There’s currently no way to search the logs for multiple functions at once. Whilst AWS has been improving the service, it still pales in comparison to other alternatives on the market.
It might suffice as you start out, but you’ll probably find yourself in need of something more soon after.
Fortunately, it’s straightforward to get your logs out of CloudWatch Logs.
You can stream them to Amazon’s hosted Elasticsearch service. But don’t expect it to be a like-for-like experience with your self-hosted ELK stack though. Liz Bennett wrote a detailed post on some of the problems they ran into when using Amazon Elasticsearch at scale. Please give that a read if you’re thinking about adopting Amazon Elasticsearch.
Alternatively, you can stream the logs to a Lambda function, and ship them to a log aggregation service of your choice. I won’t go into detail here as I have written about it at length previously, just go and read this post instead.
CloudWatch Metrics
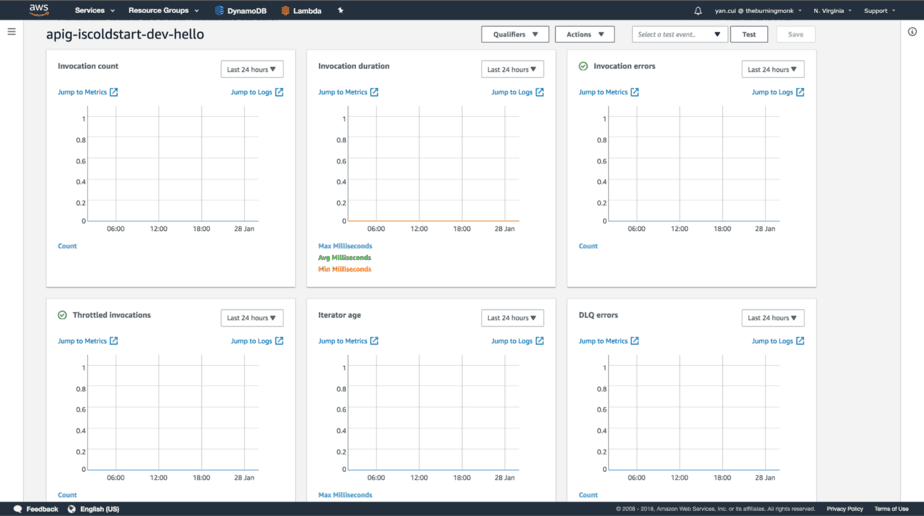
With CloudWatch, you get some basic metrics out of the box. Invocation count, error count, invocation duration, etc. All the basic telemetry about the health of a function.
But CloudWatch is missing some valuable data points, such as:
- estimated costs
- concurrent executions : CloudWatch does report this metric, but only for functions with reserved concurrency
- cold starts
- billed duration : Lambda reports this in CloudWatch Logs, at the end of every invocation. Because Lambda invocations are billed in 100ms blocks, a 102ms invocation would be billed for 200ms. It will be a useful metric to see alongside Invocation Duration to identify cost optimizations)
- memory usage : Lambda reports this in CloudWatch Logs too, but it’s not recorded as a CloudWatch metric
There are ways to record and track these metrics yourself, see this post on how to do that. Other providers like IOPipe (more on them in the next post) would also report these data points out of the box.
You can set up Alarms in CloudWatch against any of these metrics, here are a few metrics that you should consider alert on:
- throttled invocations
- regional concurrent executions : set threshold based on % of your current regional limit
- tail (95 or 99 percentile) latency against some acceptable threshold
- 4xx and 5xx errors on API Gateway
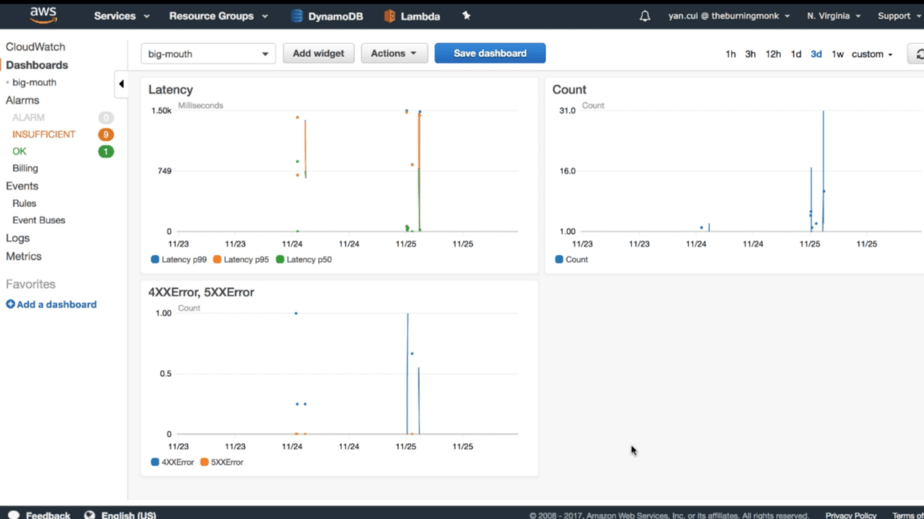
And you can set up basic dashboard in CloudWatch too, at a tiny cost of $3 per month per dashboard (first 3 are free).
X-Ray
For distributed tracing, you have X-Ray. To make the most of tracing, you should instrument your code to gain even better visibility.
Like CloudWatch Logs, collecting traces do not add additional time to your function’s invocation. It’s a background processing that the platform provides for you.
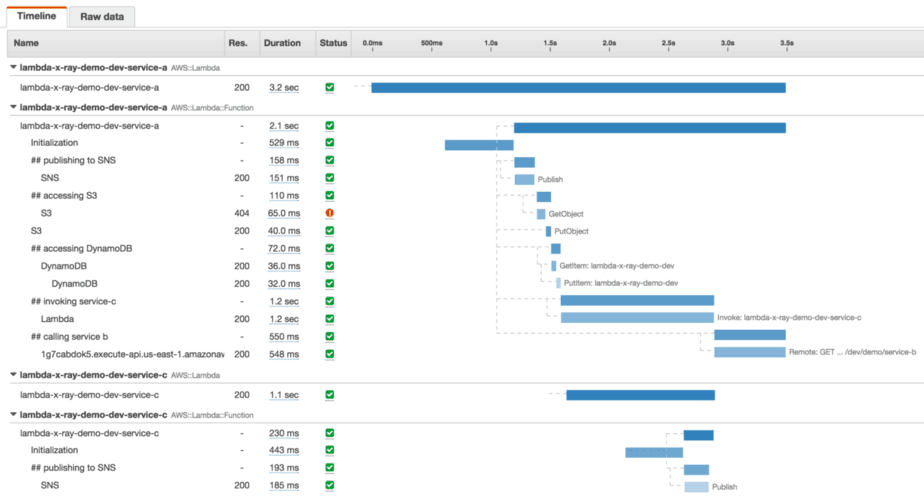
From the tracing data, X-Ray can also show you a service map like this one.
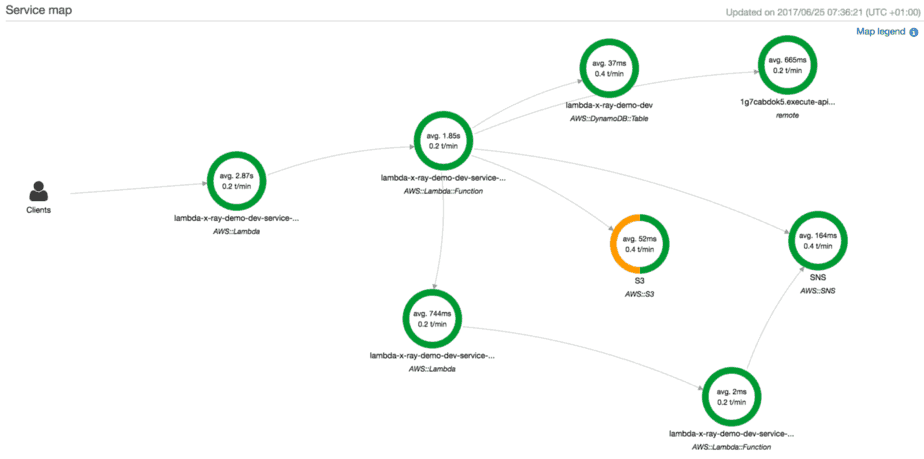
X-Ray gives you a lot of insight into the runtime performance of a function. However, its focus is narrowly on one function, the distributed aspect is severely undercooked. As it stands, X-Ray currently doesn’t trace over API Gateway, or asynchronous invocations such as SNS or Kinesis.
It’s good for homing in on performance issues for a particular function. But it offers little to help you build intuition about how your system operates as a whole. For that, I need to step away from what happens inside one function, and be able to look at the entire call chain.
After all, when the engineers at Twitter were talking about the need for observability, it wasn’t so much to help them debug performance issues of any single endpoint, but to help them make sense of the behaviour and performance of their system. A system that is essentially one big, complex and highly connected graph of services.
With Lambda, this graph is going to become a lot more complex, more sparse and more connected because:
- instead of one service with 5 endpoints, you now have 5 functions
- functions are connected through a greater variety of mediums – SNS, Kinesis, API Gateway, IoT, you name it
- event-driven architecture has become the norm
Our tracing tools need to help us make sense of this graph. They need to help us visualize the connections between our functions. And they need to help us follow data as it enters our system as a user request, and reaches out to far corners of this graph through both synchronous and asynchronous events.
And of course, X-Ray do not span over non-AWS services such as Auth0, or Google BigQuery, or Azure functions.
But those of us deep in the serverless mindset see the world through SaaS-tinted glasses. We want to use the service that best addresses our needs, and glue them together with Lambda.
At Yubl, we used a number of non-AWS services from Lambda. Auth0, Google BigQuery, GrapheneDB, MongoLab, and Twillio to name a few. And it was great, we don’t have to be bound by what AWS offers.
My good friend Raj also did a good talk at NDC on how he uses services from both AWS and Azure in his wine startup. You can watch his talk here.

And finally, I think of our system like a brain. Like a brain, our system is made up of:
- neurons (functions)
- synapses (connections between functions)
- and electrical signals (data) that flow through them
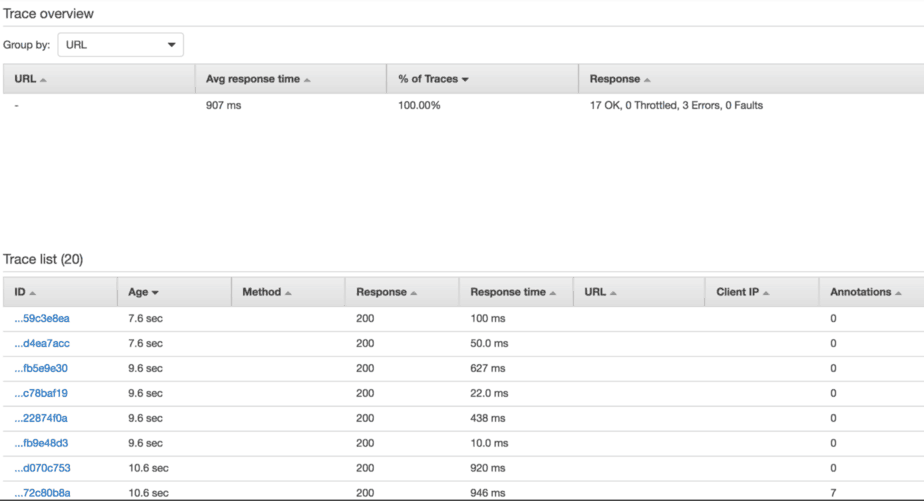
Like a brain, our system is alive, it’s constantly changing and evolving and it’s constantly working! And yet, when I look at my dashboards and my X-Ray traces, that’s not what I see. Instead, I see a tabulated list that does not reflect the movement of data and areas of activity. It doesn’t help me build up any intuitive understanding of what’s going on in my system.
A brain surgeon wouldn’t accept this as the primary source of information. How can they possibly use it to build a mental picture of the brain they need to cut open and operate on?
I should add that this is not a criticism of X-Ray, it is built the same way most observability tools are built.
But maybe our tools need to evolve beyond human computer interfaces (HCI) that wouldn’t look out of place on a clipboard (the physical kind, if you’re old enough to have seen one!). And it actually reminds me of one of Bret Victor’s seminal talks, stop drawing dead fish.
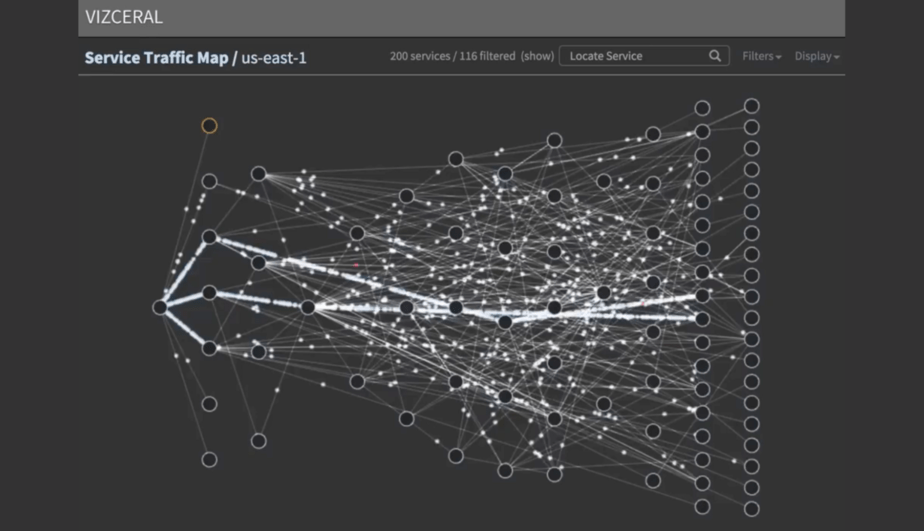
Netflix made great strides towards this idea of a live dashboard with Vizceral. Which they have also kindly open sourced.
Conclusions
AWS provides us with some decent tools out of the box. Whilst they each have their shortcomings, they’re good enough to get started with.
As 1st party tools, they also enjoy home field advantages over 3rd party tools. For example, Lambda collects logs and traces without adding to your function invocation time. Since we can’t access the server anymore, 3rd party tools cannot perform any background processing. Instead they have to resort to workarounds or are forced to collect data synchronously.
However, as our serverless applications become more complex, these tools need to either evolve with us or they will need to be replaced in our stack. CloudWatch Logs for instance, cannot search across multiple functions. It’s often the first piece that need to be replaced once you have more than a dozen functions.
In the next post, we will look at some 3rd party tools such as IOPipe, Dashbird and Thundra. We will discuss their value-add proposition as well as their shortcomings.
Whenever you’re ready, here are 3 ways I can help you:
- Production-Ready Serverless: Join 20+ AWS Heroes & Community Builders and 1000+ other students in levelling up your serverless game. This is your one-stop shop for quickly levelling up your serverless skills.
- I help clients launch product ideas, improve their development processes and upskill their teams. If you’d like to work together, then let’s get in touch.
- Join my community on Discord, ask questions, and join the discussion on all things AWS and Serverless.