
Yan Cui
I help clients go faster for less using serverless technologies.
It’s common practice to set log level to WARNING for production due to traffic volume. This is because we have to consider various cost factors:
- cost of logging : CloudWatch Logs charges $0.50 per GB ingested. In my experience, this is often much higher than the Lambda invocation costs
- cost of storage : CloudWatch Logs charges $0.03 per GB per month, and its default retention policy is Never Expire! A common practice is to ship your logs to another log aggregation service and to set the retention policy to X days. See this post for more details.
- cost of processing : if you’re processing the logs with Lambda, then you also have to factor in the cost of Lambda invocations.
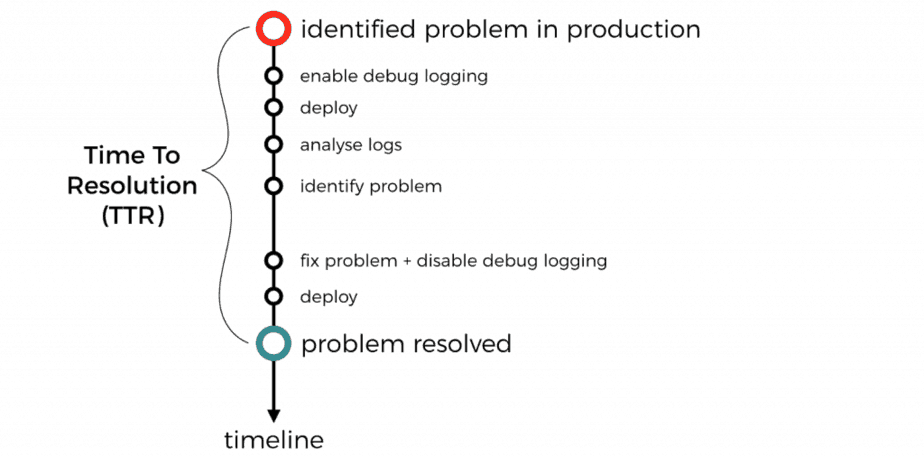
But, doing so leaves us without ANY debug logs in production. When a problem happens in production, you won’t have the debug logs to help identify the root cause.
Instead you have to waste precious time to deploy a new version of your code to enable debug logging. Not to mention that you shouldn’t forget to disable debug logging when you deploy the fix.
With microservices, you often have to do this for more than one service to get all the debug messages you need.
All these, increases the mean time to recovery (MTTR) during an incident. That’s not what we want.
It doesn’t have to be like that.
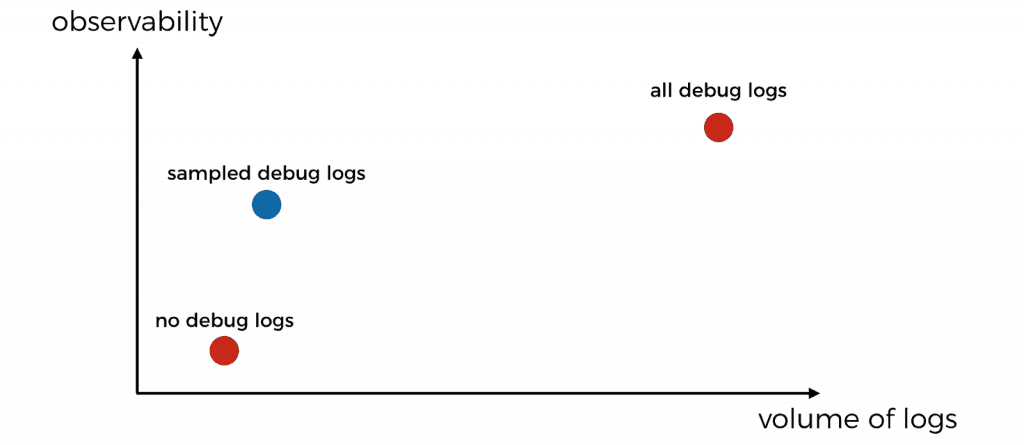
There is a happy middle ground between having no debug logs and having all the debug logs. Instead, we should sample debug logs from a small percentage of invocations.
How?
I demoed how to do this in the Logging chapter of my video course Production-Ready Serverless. You need two basic things:
- a logger that lets you to change the logging level dynamically, e.g. via environment variables.
- a middleware engine such as middy
With Lambda, I don’t need most of the features from a fully-fledged logger such as pino. Instead, I prefer to use a simple logger module like this one. It’s written in a handful of lines and gives me the basics:
- structured logging with JSON
- ability to log at different levels
- ability to control the log level dynamically via environment variables
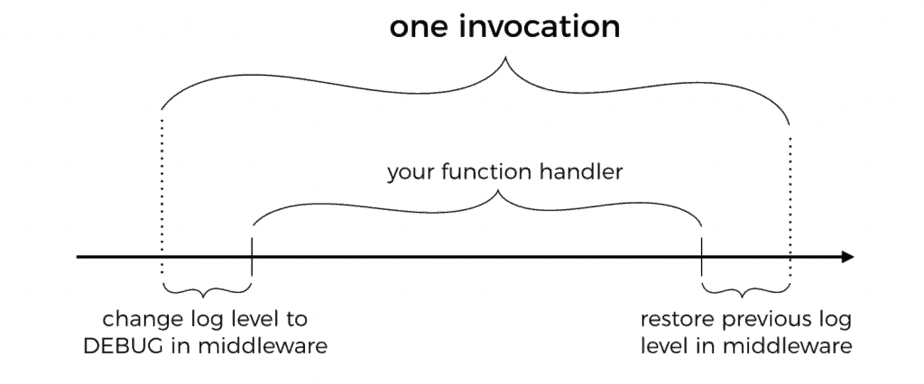
Using middy, I can create a middleware to dynamically update the log level to DEBUG. It does this for a configurable percentage of invocations. At the end of the invocation the middleware would restore the previous log level.
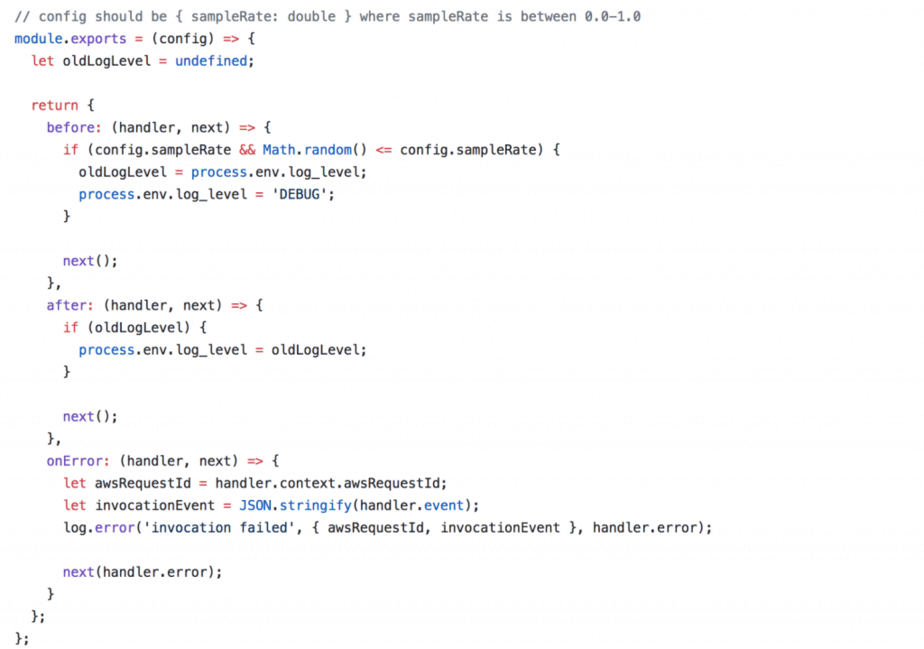
You might notice that we also have some special handling for when the invocation errs.
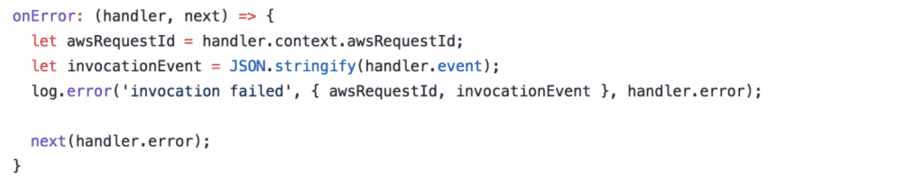
This is to ensure we capture the error with as much context as possible, including:
- the unique AWS Request ID
- the invocation event, so we can replay the invocation event locally and debug the problem
- the error message and stacktrace
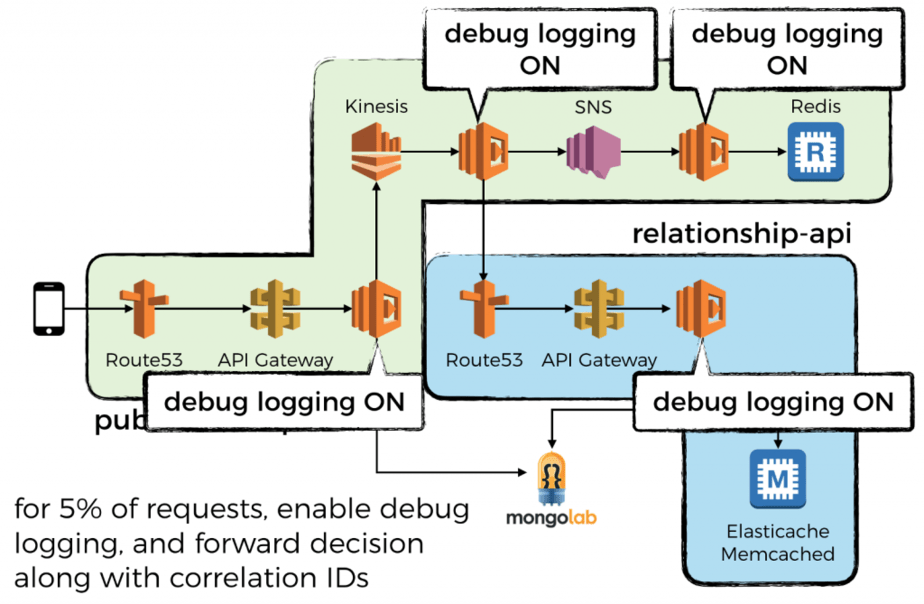
Sample debug logs on entire call chains
Having debug logs for a small percentage of invocation is great. But when you’re dealing with microservices you need to make sure that your debug logs cover an entire call chain.
That is the only way to put together a complete picture of everything that happened on that call chain. Otherwise, you will end up with fragments of debug logs from many call chains but never the complete picture of one.
You can do this by forwarding the decision to turn on debug logging as a correlation ID. The next function in the chain would respect this decision, and pass it on. See this post for more detail.
So that’s it, another pro tip on how to build observability into your serverless application. If you want to learn more about how to go all in with serverless, check out my 10-step guide here.
Until next time!
Whenever you’re ready, here are 3 ways I can help you:
- Production-Ready Serverless: Join 20+ AWS Heroes & Community Builders and 1000+ other students in levelling up your serverless game. This is your one-stop shop for quickly levelling up your serverless skills.
- I help clients launch product ideas, improve their development processes and upskill their teams. If you’d like to work together, then let’s get in touch.
- Join my community on Discord, ask questions, and join the discussion on all things AWS and Serverless.