Yan Cui
I help clients go faster for less using serverless technologies.
On application monitoring
In the Gamesys social team, our view on application monitoring is such that anything that runs in production needs to be monitored extensively all the time – every service entry point, IO operations or CPU intensive tasks. Sure, it comes at the cost of a few CPU cycles which might mean that you have to run a few more servers at scale, but that’s small cost to pay compared to:
- lack of visibility of how your application is performing in production; or
- inability to spot issues occurring on individual nodes amongst large number of servers; or
- longer time to discovery on production issues, which results in
- longer time to recovery (i.e. longer downtime)
- loss of customers (immediate result of downtime)
- loss of customer confidence (longer term impact)
Services such as StackDriver and Amazon CloudWatch also allow you to set up alarms around your metrics so that you can be notified or some automated actions can be triggered in response to changing conditions in production.
In Michael T. Nygard’s Release It!: Design and Deploy Production-Ready Software (a great read by the way) he discussed at length how unfavourable conditions in production can cause cracks to appear in your system, and through tight coupling and other anti-patterns these cracks can accelerate and spread across your entire application and eventually bring it crashing down to its knees.
In applying extensive monitoring to our services we are able to:
- see cracks appearing in production early; and
- collect extensive amount of data for the post-mortem; and
- use knowledge gained during post-mortems to identify early warning signs and set up alarms accordingly
Introducing Metricano
With our emphasis on monitoring, it should come as no surprise that we have long sought to make it easy for our developers to monitor different aspects of their service.
Now, we’ve made it easy for you to do the same with Metricano, an agent-based framework for collecting, aggregating and publishing metrics from your application. From a high-level, the MetricsAgent class collects metrics and aggregates them into second-by-second summaries. These summaries are then published to all the publishers you have configured.
Recording Metrics
There are a number of options for you to record metrics with MetricsAgent:
Manually
You can call the IncrementCountMetric, or RecordTimeMetric methods on an instance of IMetricsAgent (you can use MetricsAgent.Default or create a new instance with MetricsAgent.Create), for example:
F# Workflows
From F#, you can also use the built-in timeMetric and countMetric workflows:
PostSharp Aspects
Lastly, you can also use the CountExecution and LogExecutionTime attributes from the Metricano.PostSharpAspects nuget package, which can be applied at method, class and even assembly level.
The CountExecution attribute records a count metric with the fully qualified name of the method, whereas the LogExecutionTime attribute records execution times into a time metric with the fully qualified name of the method. When applied at class and assembly level, the attributes are multi-casted to all encompassed methods, private, public, instance and static. It’s possible to target specific methods, by name or visibility, etc. please refer to PostSharp’s documentation for detail.
Publishing Metrics
All the metrics you record won’t do you much good if they just stay inside the memory of your application server.
To get metrics out of your application server and into a monitoring service or dashboard, you need to tell Metricano to publish metrics with a set of publishers. There is a ready made publisher for Amazon CloudWatch service in the Metricano.CloudWatch nuget package.
To add a publisher to the pipeline, use the Publish.With static method, see example here.
Since the lowest granularity on Amazon CloudWatch is 1 minute, so as an optimization to cut down on the number of web requests (which also has a cost impact), CloudWatchPublisher will aggregate metrics locally and only publish the aggregates on a per minute basis.
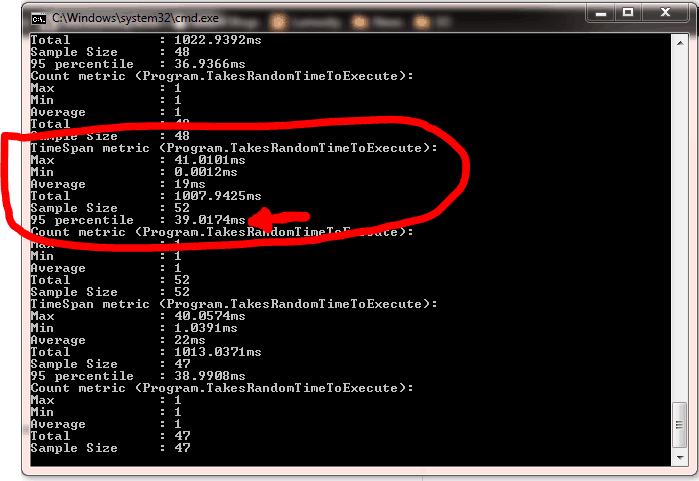
If you want to publish your metric data to another service (StackDriver or New Relic for instance), you can create your own publisher by implementing the very simple IMetricsPublisher interface. This simple ConsolePublisher for instance, will calculate the 95 percentile execution time and print them:

In general I find the 95/97/99 percentile time metrics much more informative than simple averages, since averages are so easily biased by even a small number of outlying data points.
Summary
I hope you have enjoyed this post and that you’ll find Metricano a useful addition in your application.
I highly recommend reading Release It!, much of the patterns and anti-patterns discussed in the book are becoming more and more relevant in today’s world where we’re building smaller, more granular microservices. Even the simplest of applications have multiple integration points – social networks, cloud services, etc. – and they are places where cracks are likely to occur before they spread out to the rest of your application, unless, you have taken the measure to guard against such cascading failures.
If you decide to buy the book from amazon, please use the link I provide below or add the query string parameter tag=theburningmon-21 to the URL so that I can get a small referral fee and use it towards buying more books and finding more interesting things to write about here ![]()
Links
Release It!: Design and Deploy Production-Ready Software
Metricano.CloudWatch nuget package
Metricano.PostSharpAspects nuget package
Red-White Push – Continuous Delivery at Gamesys Social
Whenever you’re ready, here are 3 ways I can help you:
- Production-Ready Serverless: Join 20+ AWS Heroes & Community Builders and 1000+ other students in levelling up your serverless game. This is your one-stop shop for quickly levelling up your serverless skills.
- I help clients launch product ideas, improve their development processes and upskill their teams. If you’d like to work together, then let’s get in touch.
- Join my community on Discord, ask questions, and join the discussion on all things AWS and Serverless.


Pingback: Year in Review, 2014 | theburningmonk.com